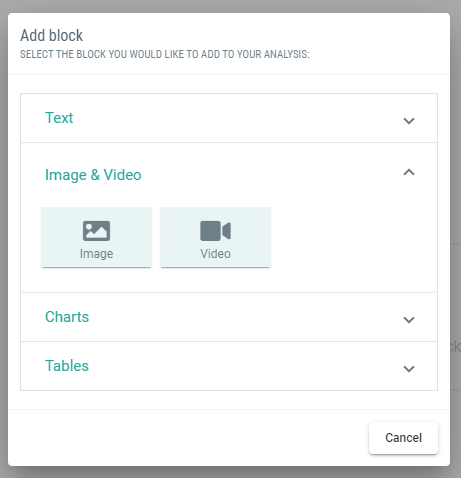
Adding Blocks
Users can edit/create a new document or analysis by adding blocks. These blocks allow you to add Text, Images, Videos, Charts, and Tables.
To add a new block to the analysis, click on the "Add new block" (see figure Adding a New Block). This opens a new dialog box where the user can choose the type of blocks.
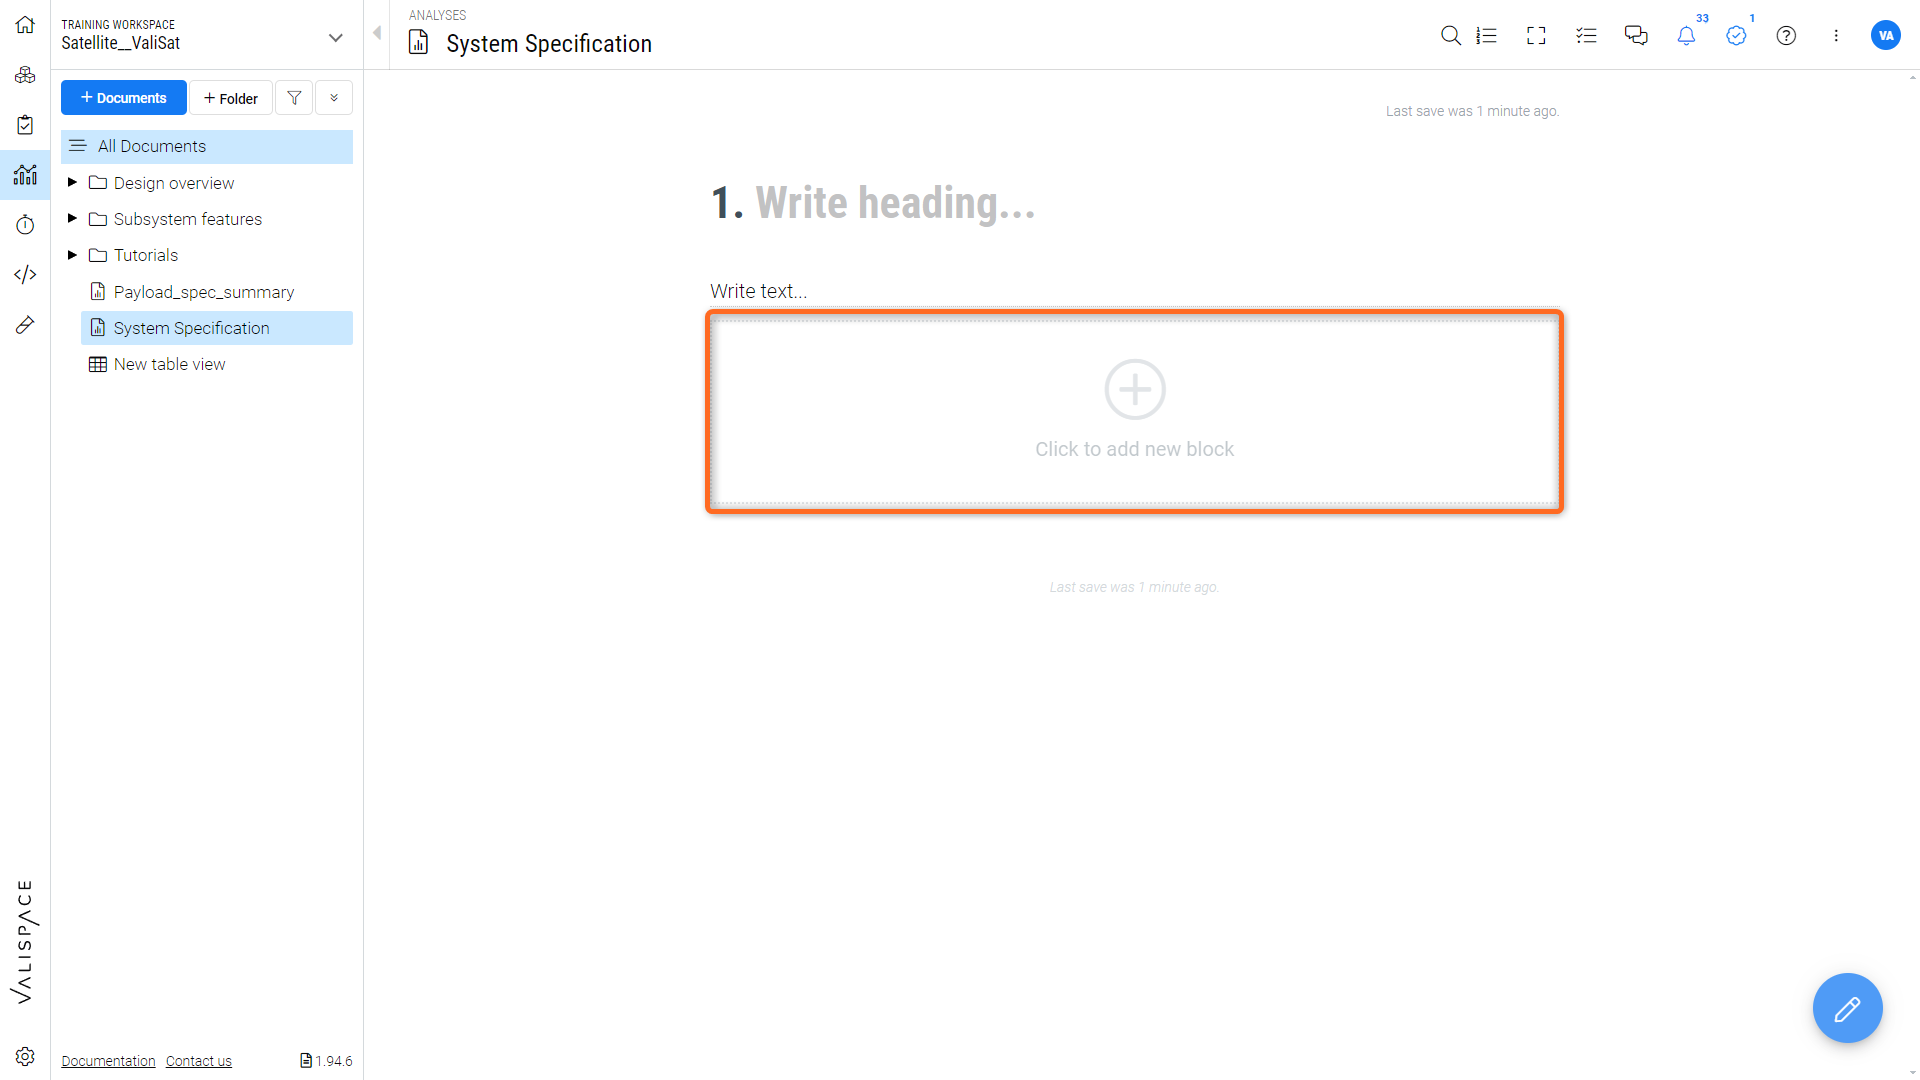
Adding a New Block: A screenshot showing the option to add a new block to a document, highlighted for emphasis.
Writing text (Text Block)
When adding a text block, you can choose between different levels of headings, normal text, statements, and formulas(see Figure Text Block Options). Choose the one which best suits your purpose and start editing.

Text Block Options: An image displaying different options for adding text blocks, such as headings, normal text, statements, and formulas.
Headings: Organize your document using headings. Choose from six levels—Heading 1 for main titles down to Heading 6 for sub-sub-sections—to structure your content hierarchically.
Normal Text: The backbone of your document, the 'Normal text' option is for writing the main content. Use it for paragraphs, descriptions, and general information.
Statement: The 'Statement' block highlights key points or quotes authoritative sources. It is ideal for showcasing referenced material or important notes.
Formula: The 'Formula' block lets you incorporate equations seamlessly into mathematical and technical analyses. Input using a LaTeX-style editor, and let the Requirements and Systems Portal handle the rest.
Table of Contents: Insert a 'Table of contents' block to ensure easy navigation through your document. This block automatically organizes and links to your headings.
To format the text, select the desired text and select the formatting or use the shortcuts seen below in Figure Text Formatting Toolbar:
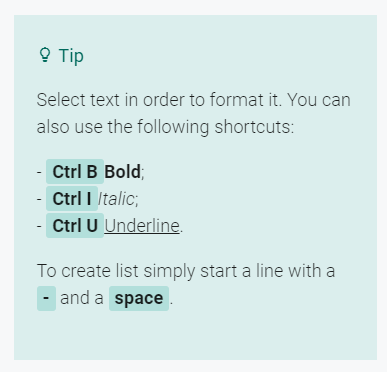
Text Formatting Toolbar: A picture of the text formatting toolbar with various options like bold, italic, underline, and more.
Referencing Valis - To reference the value of a Vali in the text, type a dollar sign $, and start typing the name of the Vali in the popup box. The value of the Vali will be shown in the text once you click outside the block. You can also add a new Vali to the analysis by clicking the "create new" button in the top right corner, as highlighted below in Figure Referencing Values.
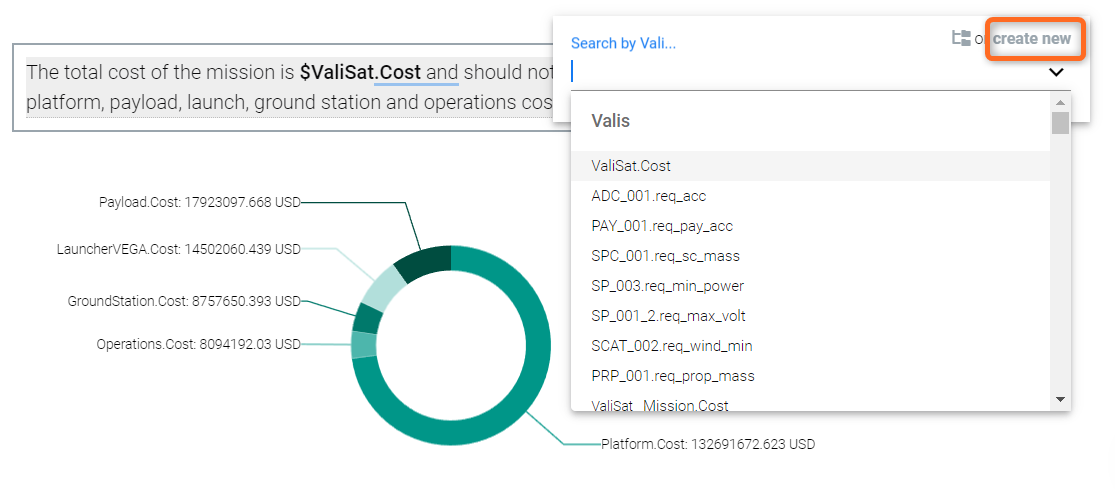
Referencing Values: An example of how to reference values within a text block, with a pop-up box suggesting variable names as you type.
Images and videos block
You can add images and videos to your document to make it more dynamic as shown in the Figure Adding Images and Videos.
Adding Images and Videos: A demonstration of adding multimedia elements like images and videos to enrich the document content.
Tables block
There are three kinds of tables to add to an analysis: “From scratch”, “Budget”, and “Requirements”(see Figure Table Block Options)
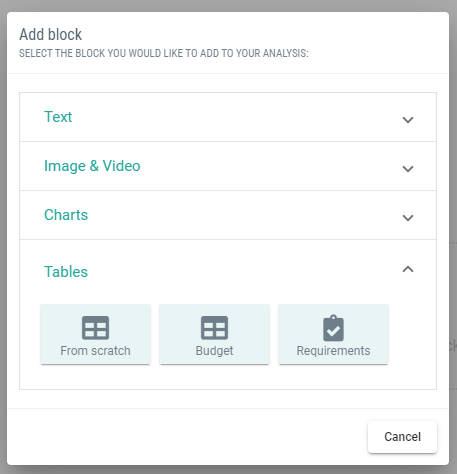
Table Block Options: This section provides an overview of the different types of tables that can be added to an analysis, such as "From Scratch," "Budget," and "Requirements."”
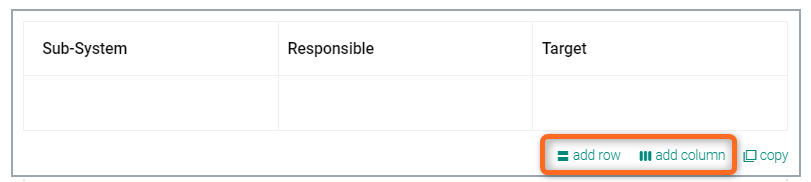
From scratch: The Requirements and Systems Portal allows you to add your custom table from scratch. You can add as many rows and columns per your project needs (see Figure Creating a Custom Table)
Creating a Custom Table: A snapshot showing the interface for creating a custom table from scratch, with options to add rows and columns.
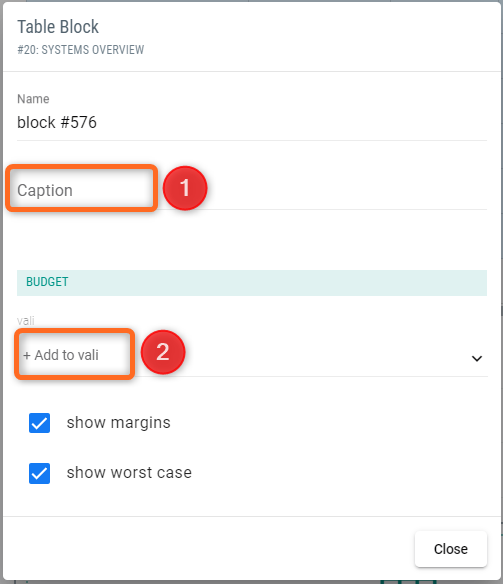
Budget: Requirements and Systems Portal provides the option to add the tables as a budget (mass budget, power budget, link budget, etc.). Once you click on Tables → Budget, a popup requires you to fill out the caption (1) and the Vali (2). Refer to Figure Budget Table Creation
Budget Table Creation: An image illustrating the process of creating a budget table, with fields for caption and Vali selection.
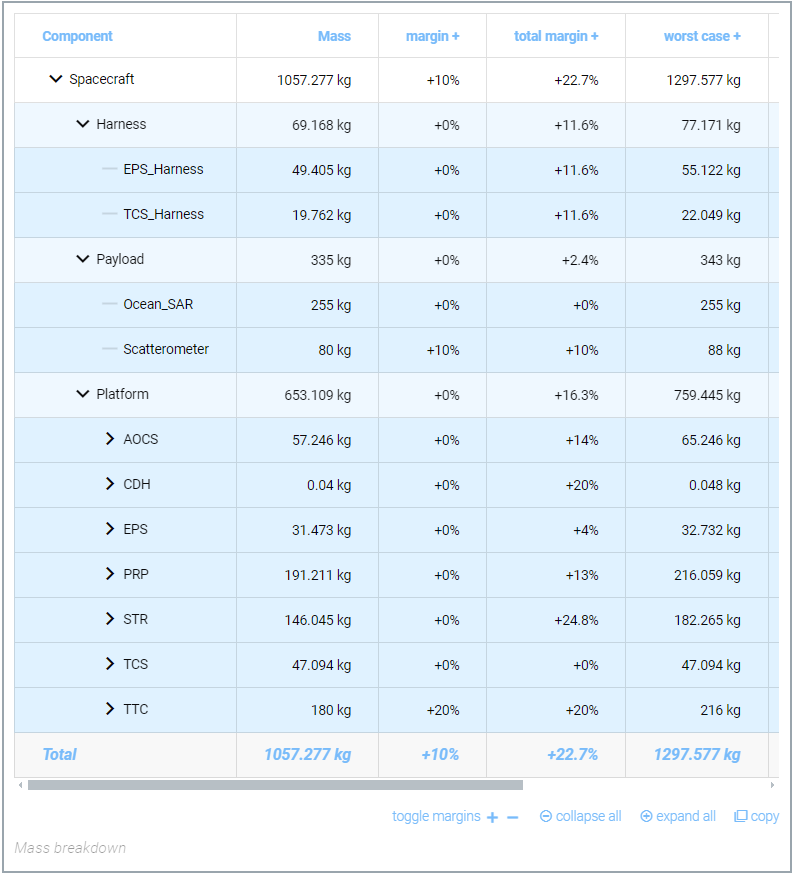
For example, if we need the mass budget of the whole system, we can add “Spacecraft.Mass” as the Vali and we get the below mass budget as a table. An example of mass budget is shown in Figure Mass Budget Table Example
Mass Budget Table Example: A specific example of a mass budget table created within the document, showcasing the structured presentation of budget information.
Requirements - As the name suggests, you can also export your requirements table to the document. Like the requirements table in the Requirement Module, you can set your filters (1) and set the columns (2) at your convenience(See Figure Exporting Requirements Table.
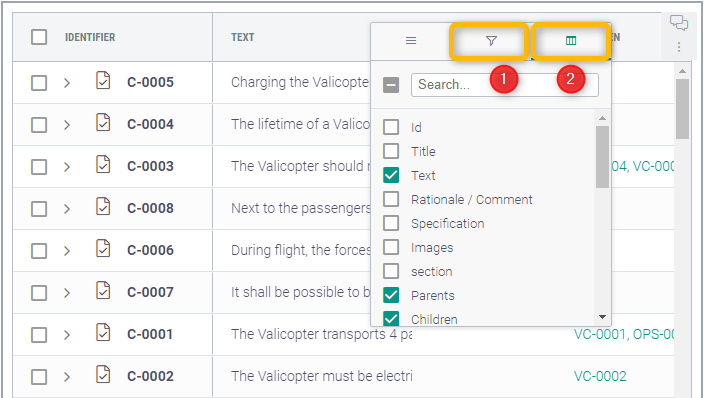
Exporting Requirements Table: A visual example of exporting a requirements table to the document, with options to set filters and columns.
Charts block
Requirements and Systems Portal also allows you to add various charts, which can add more detail to your analyses. Different types of charts can be added as a block (Refer to Figure Charts Block)
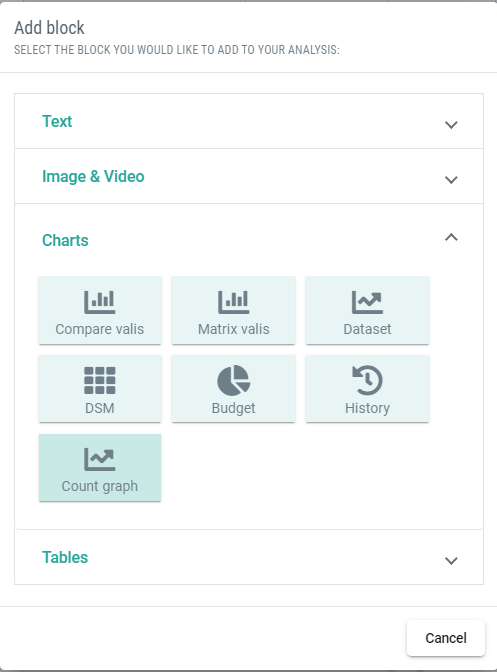
Charts Block: An introduction to the charts block, where various types of charts can be added to provide detailed analyses.
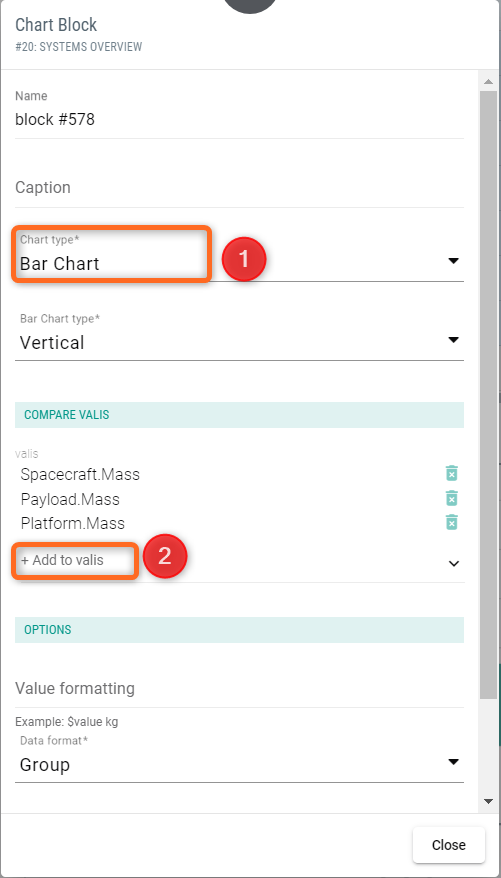
Compare Valis - You can compare any two Valis of your project. Click on “Compare Valis”, and a popup will appear. Along with other options, you can choose Chart type (1) and add Valis (2) that you wish to compare (Refer to the Figure Comparing Valis Chart).
Comparing Valis Chart: An image showing the interface for comparing two Valis, with options to select chart type and Valis for comparison.
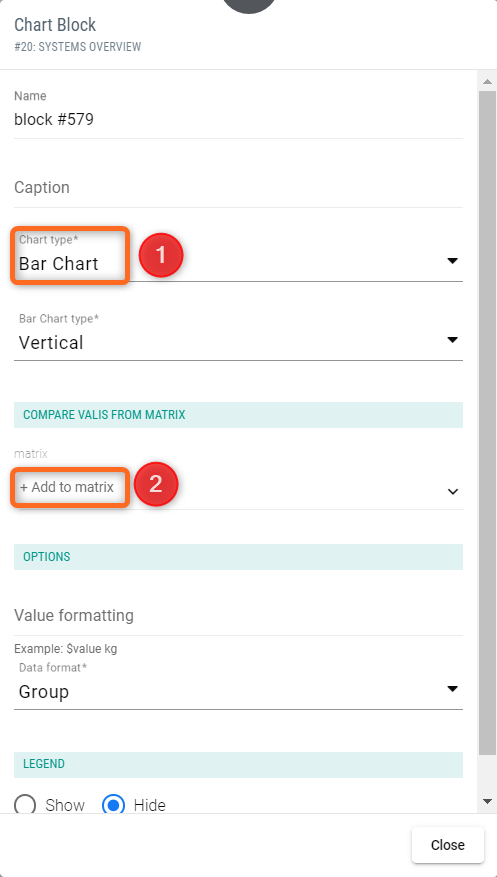
Matrix Valis - You can also compare and add your matrices to the document. This works similarly to the above option of “Compare Valis” except for the fact that you can now compare two matrices. You can also add Chart type (1) and the matrices you want to compare (2) as shown in the Figure Matrix Comparison Chart.
Matrix Comparison Chart: A depiction of how matrices can be compared within the document, similar to the "Compare Valis" feature but for matrix data.
Dataset - Now, you can represent any dataset Vali with the help of a graph and then present it in the document. Select the Dataset option and then the chart type (1) and the dataset (2) as shown in Figure Dataset Chart Representation.
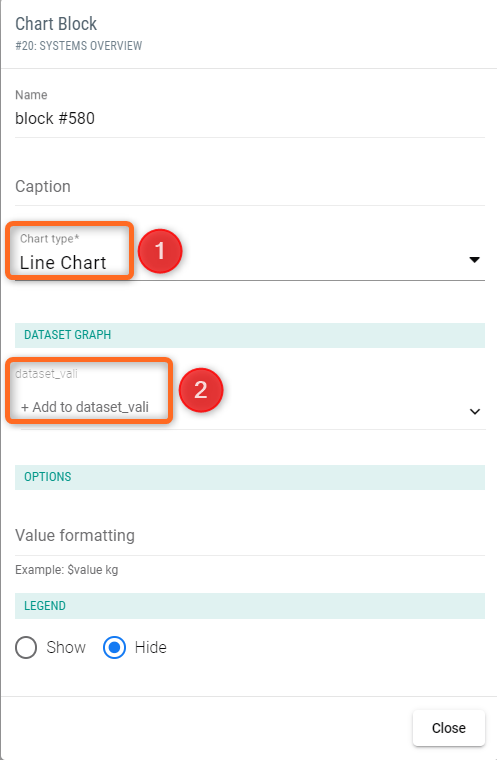
Dataset Chart Representation: An example of representing dataset Vali with a graph, highlighting the chart type and dataset selection process.
Budget - If you wish to present your data in a form of a budget (mass budget, power budget, etc), you can do this with the help of this option. Below is an example of a mass budget represented in chart (Refer to Figure Budget Representation Chart)

Budget Representation Chart: An image of a budget representation chart, possibly showing a mass budget as an example, to visually present data in budget form.
History—Suppose the value of a Vali has changed multiple times, and you would like to demonstrate how the values have changed over time. The best way to do that is to use the history feature, which will help you track the changes over time and tell you the history of the selected Vali.
Count Graphs - Count graphs are strictly made to track whether the requirements have been verified or not. It exhibits a line graph which shows the total number of requirements, the number of verified requirements, and the number of non-verified requirements.
Requirements Verification Count Graph: A line graph showing the total number of requirements, the number of verified requirements, and the number of non-verified requirements, to track requirement verification status.