Budget table and chart
Many of the Valis/Valitypes within your project’s top-level blocks will have the formula function “soc().”
soc(): Stands for "sum of children", it sums up all the Valis of the same type in the Blocks one level below (sub-Blocks).
Whenever a Vali has a soc() function as a formula, RSP automatically creates and updates budget tables and charts for Valis with the formula “soc()”, like the ones below.
Pie Chart
Note that the pie chart shows the mass distribution, which is only shown for its next lower level. To view the pie chart, click on the Vali name to open the details tab on the right side. Within the details tab, click the “pie chart symbol” (see Figure “Pie Chart for soc() Valitype“.
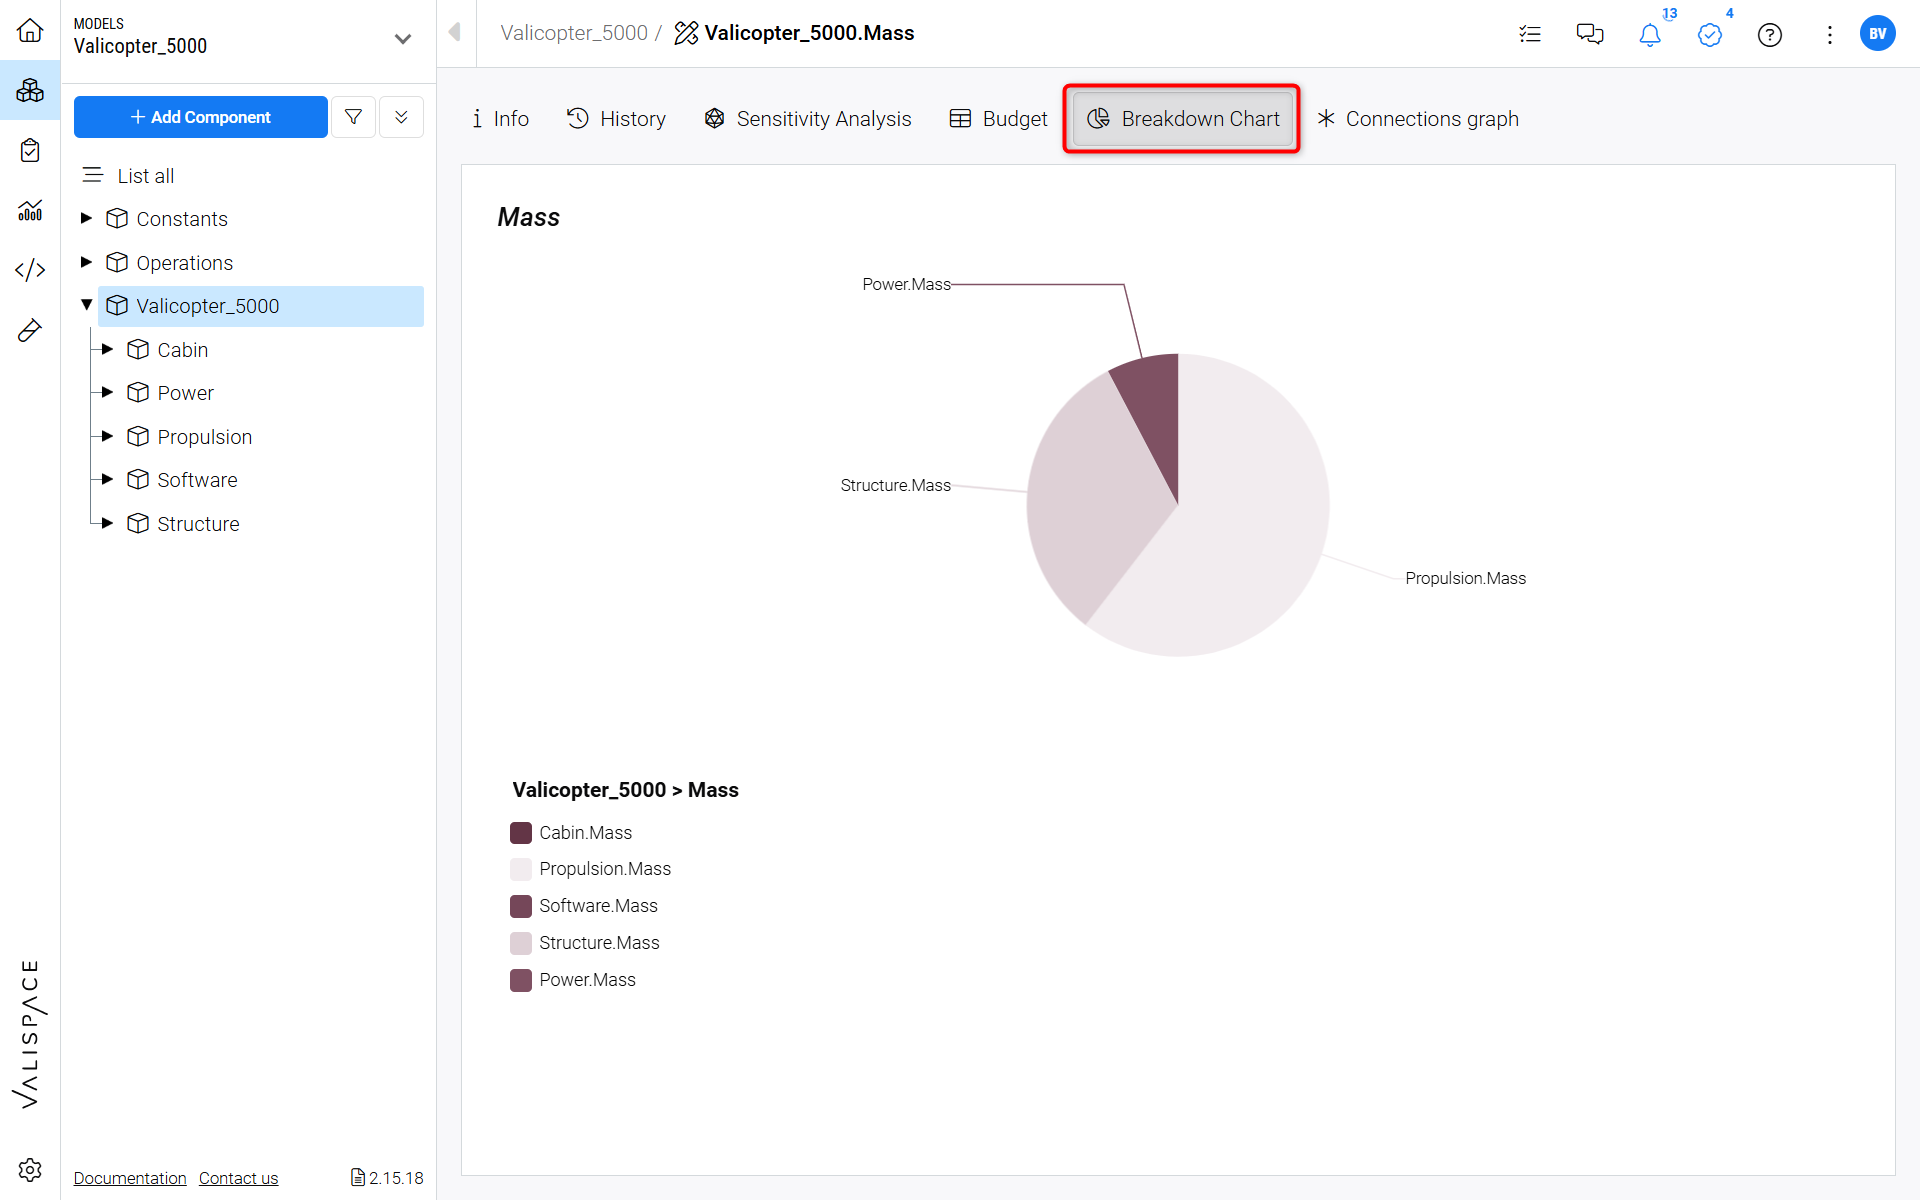
Pie Chart for soc() Valitype - When a Valitype has the soc() function special features are available in the details tab
Budget Table
The budget tables give the user the overall breakdown/distribution of the property over all the Blocks within the project. Users will have the possibility to see even the lowest element of the system. To view the budget table for the property, click on the Vali name, and the details tab on the right side opens. Within the details tab, click the “budget symbol” (see Figure “Budget table for soc() Valitype“.
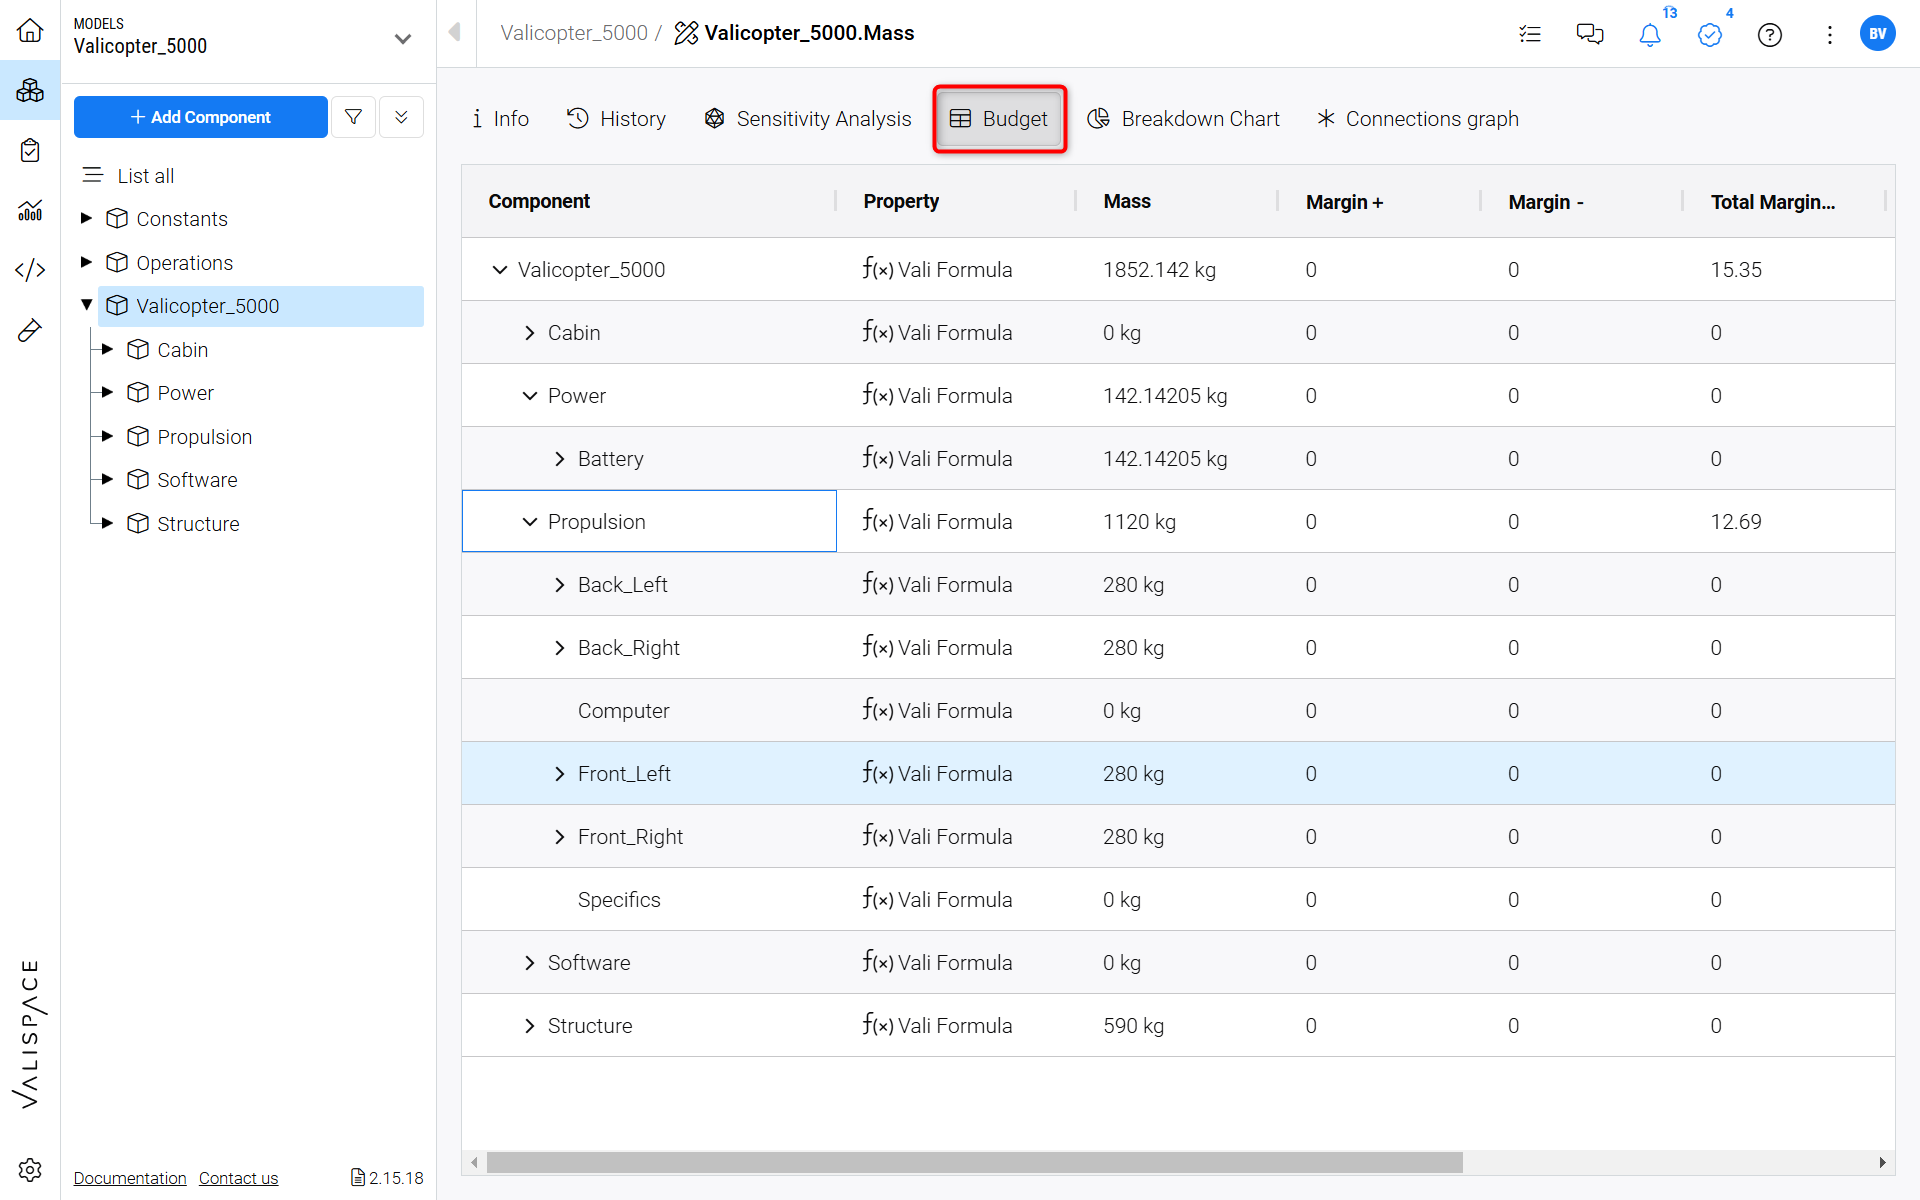
Budget table for soc() Valitype - When a Valitype has the soc() function special features are available in the details tab
Note that users can toggle margins and worscases by clicking on the sandwich icon in the column headers of the table.
Pro Tips:
You can copy the budget table and directly paste it into the excel sheet if needed
If you have set up your word plugin, you can directly import the budget table/pie chart and if the values are updated in your deployment, you can use the refresh button on the word plugin to update the values in the word document. For more information refer to the Word Plugin section.
You can add the budget table to the analysis document easily. Refer to the Analyses section