Dashboards
The Requirements and Systems Portal offers a powerful dashboard feature that equips you with valuable project insights and facilitates a quick comprehension of critical project parameters. Whether you need to monitor Mass Valis, Cost Valis, project requirements, or project status, the Requirements and Systems Portal allows you to effortlessly create customized dashboards. These dashboards can be configured for public access, sharing project insights with everyone, or kept private for your personal use, ensuring immediate access to the essential information you require.
Default Dashboard
Dashboards are conveniently accessible through the project module. The Requirements and Systems Portal provides a default dashboard that offers insightful statistics about objects created within the project. Currently, the default dashboard displays the following information:
Total number of requirements within the project
Total number of Blocks within the project
Total number of Valis within the project
Recent discussions activity within the project
Recent activity on the Requirements, Blocks, Reviews, Tasks, Valis
Verification method graph
Reviews Graph
Requirements with no Verification Methods
This default dashboard gives users a quick overview of key project metrics and data, enhancing the overall project management experience.
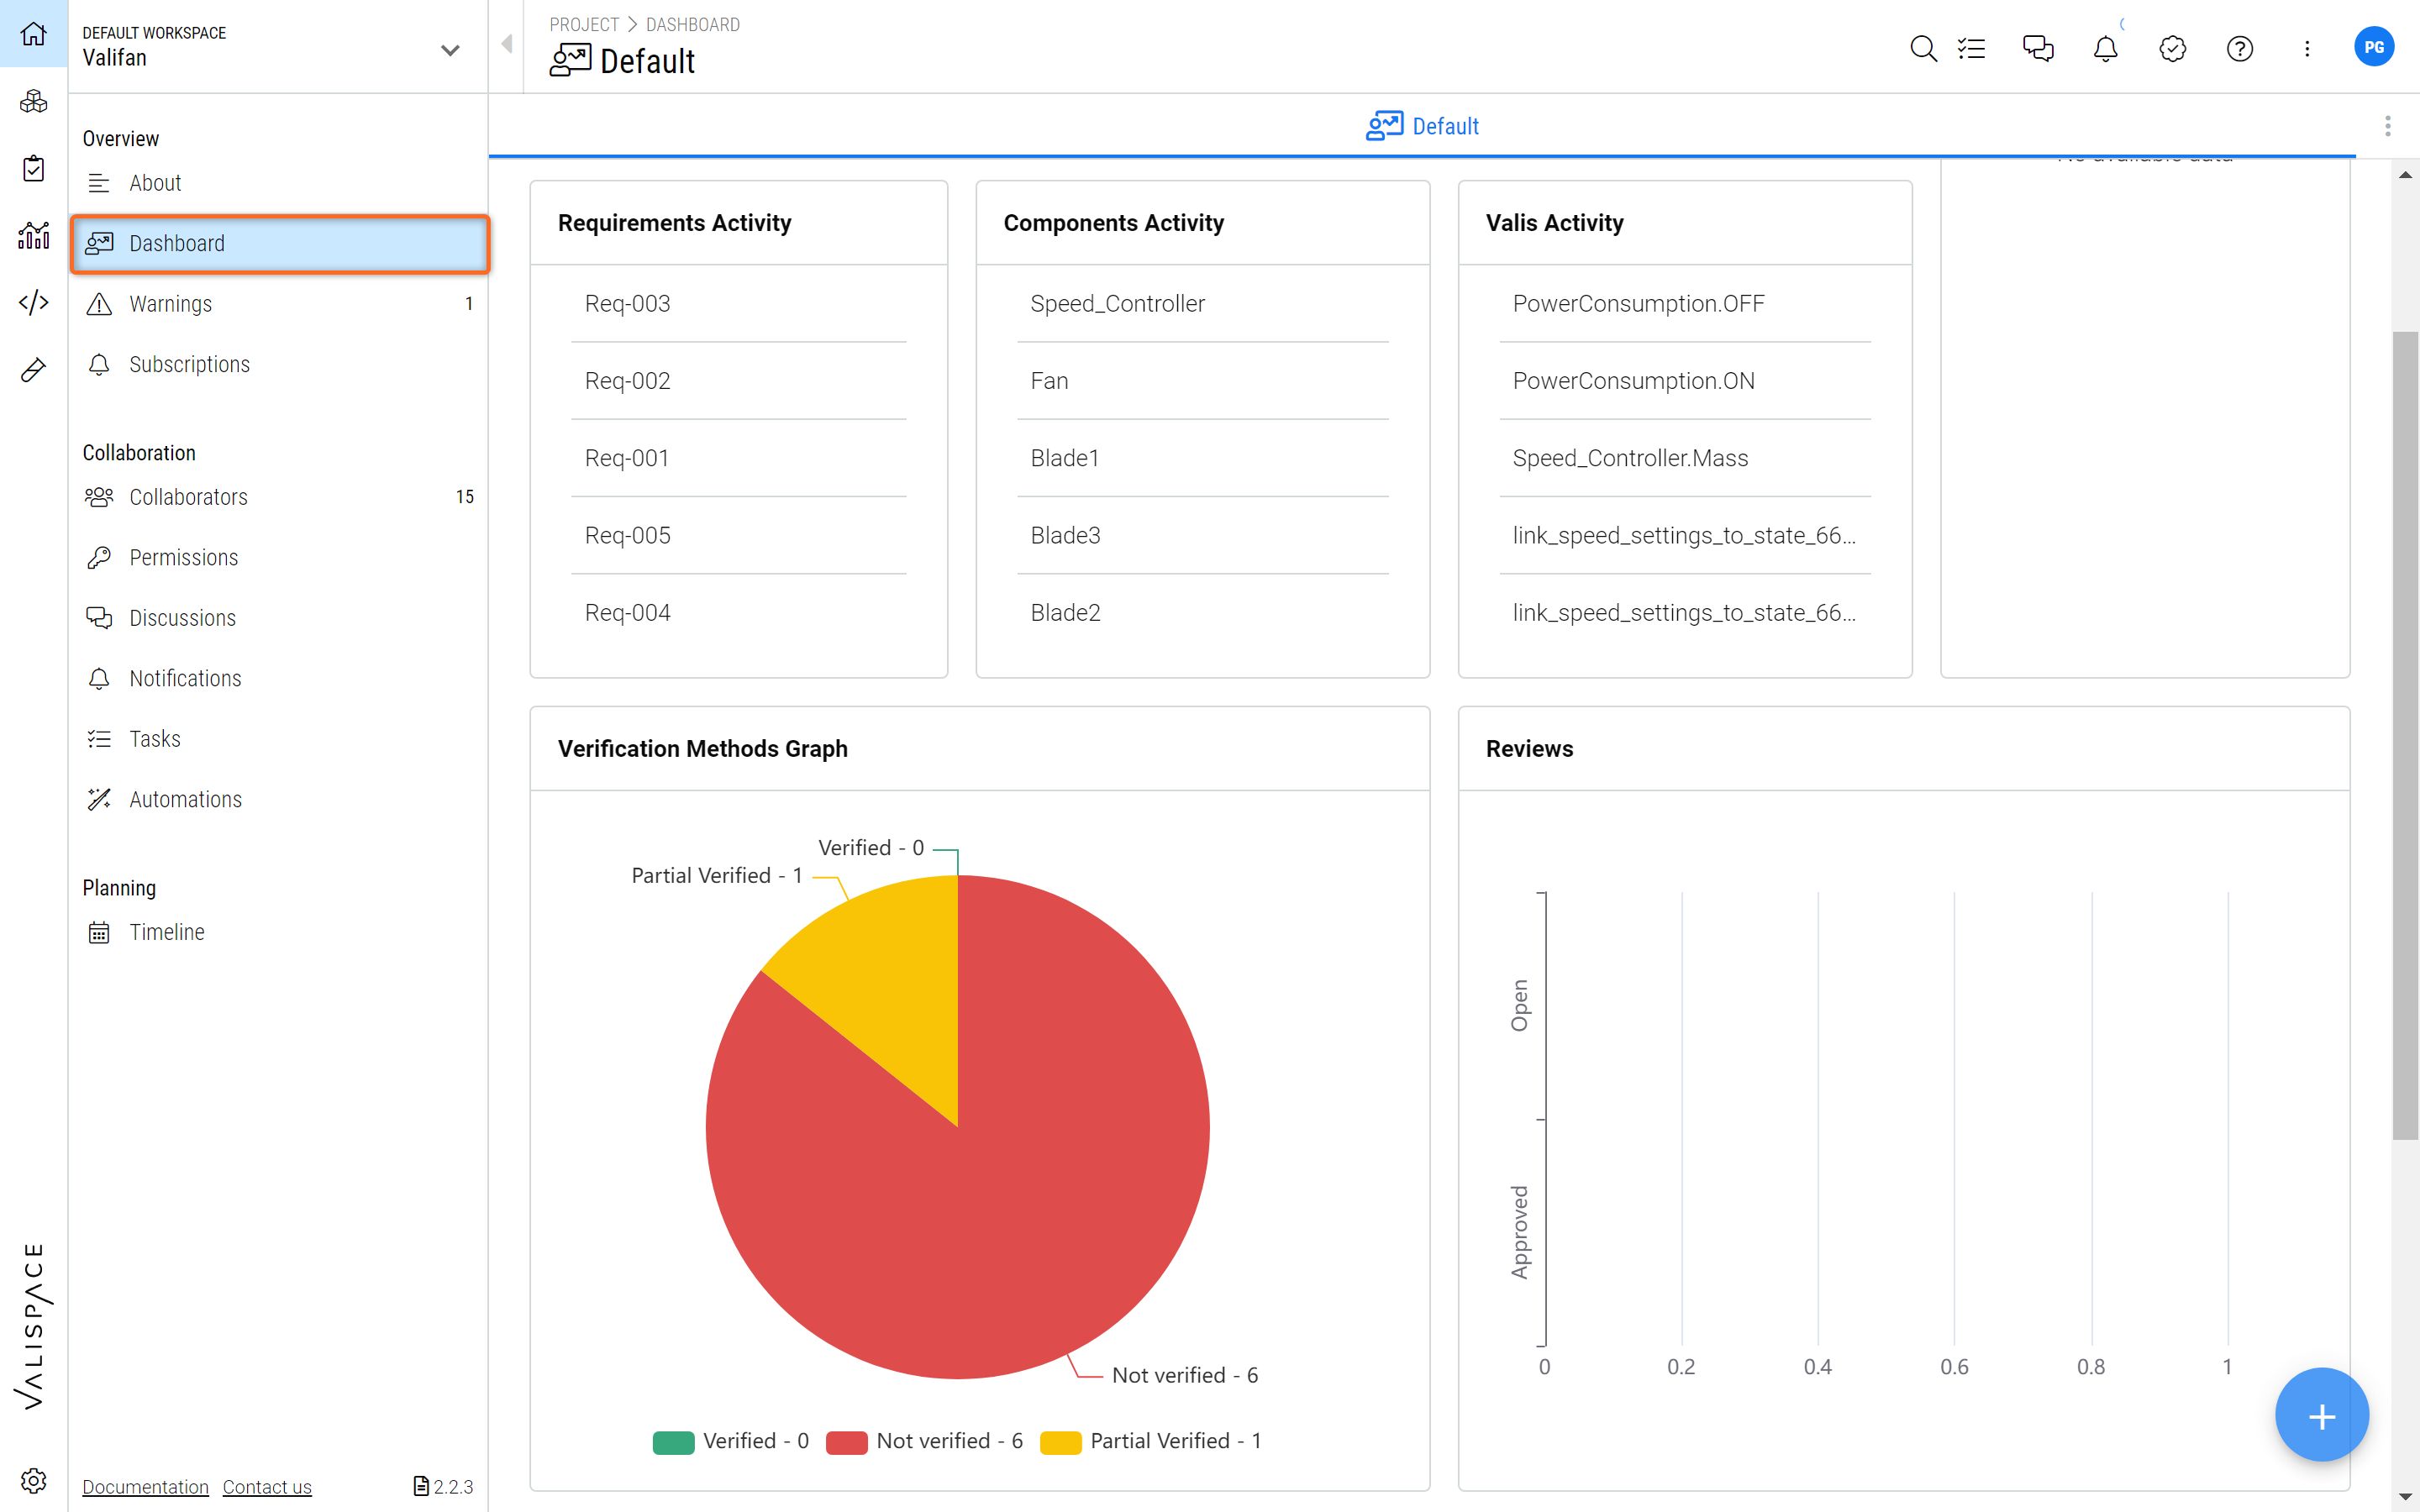
Default Dashboard - Generic overview of the Default Dashboard with all important project information.
Create a Custom Dashboard
From the Requirements and Systems Portal's main navigation pane, go to "Project" (1) and open "Dashboard" (2)
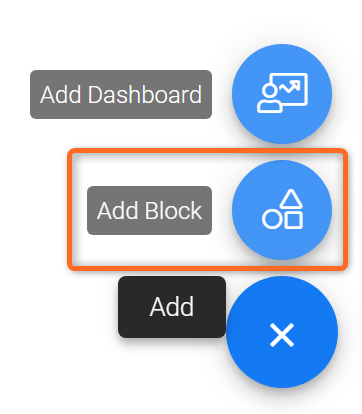
In the bottom right-hand side corner, hover over the "+" symbol (3) and choose "Add Dashboard" (4)
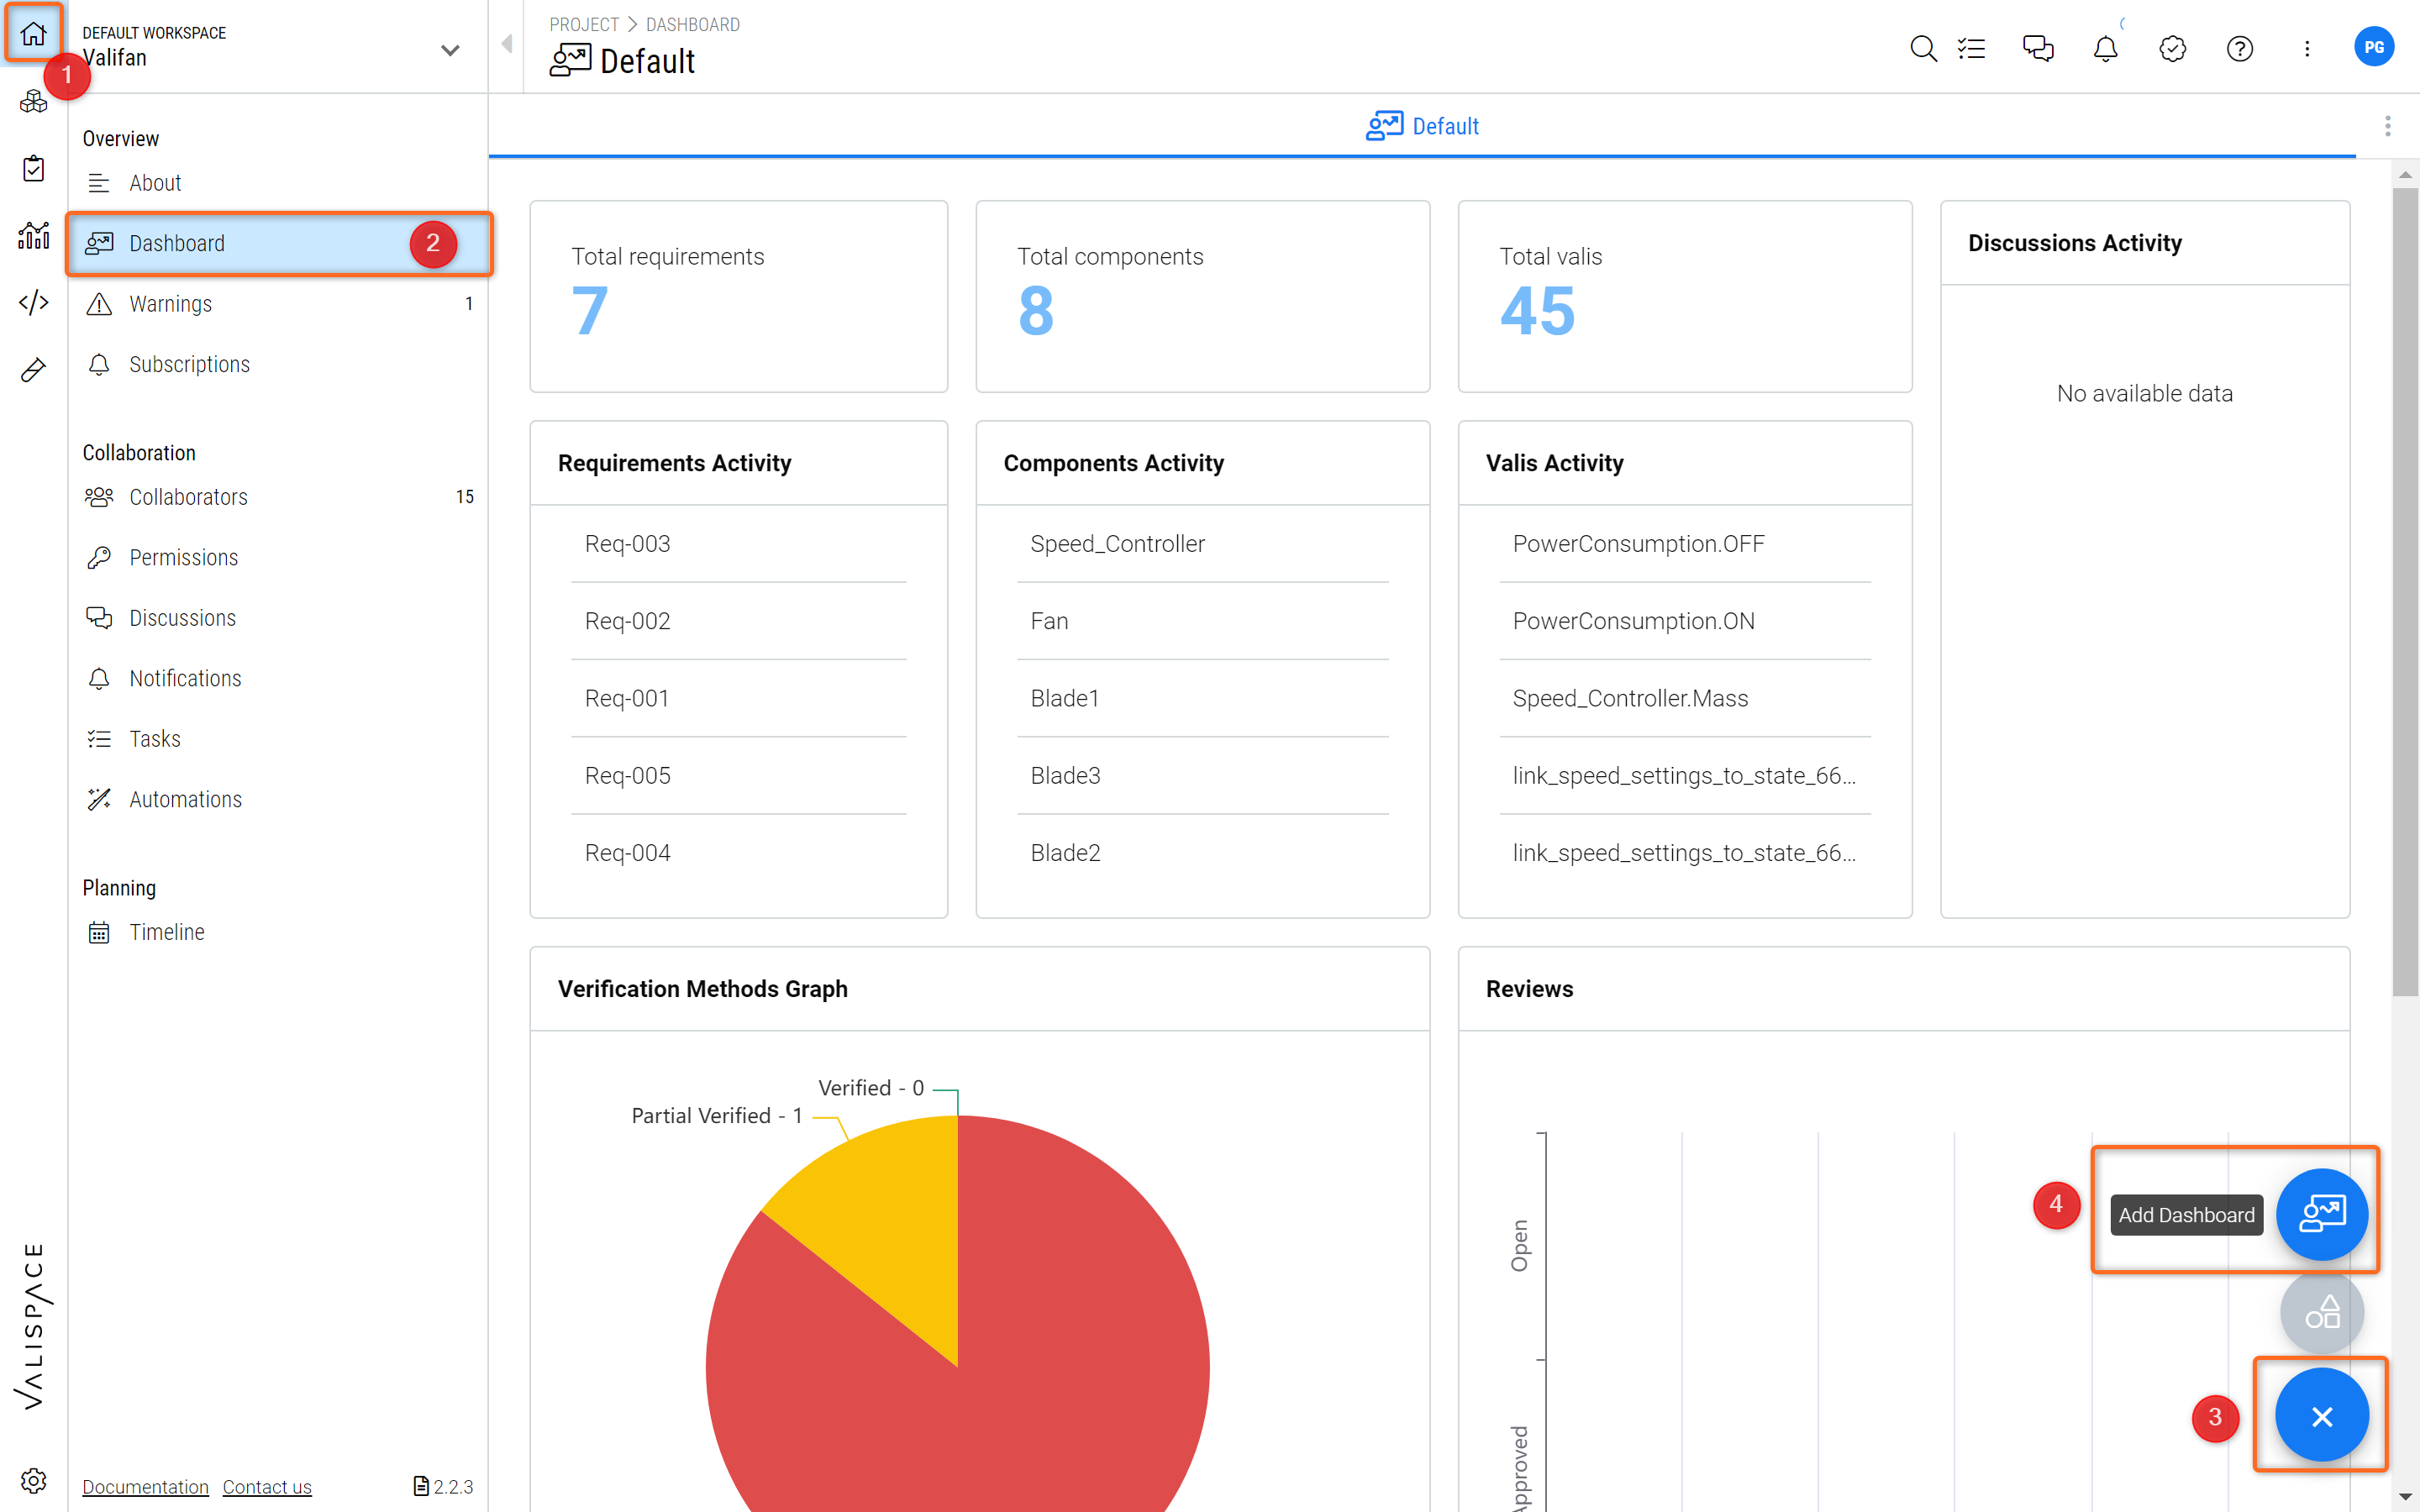
Custom Dashboard - How to create a custom dashboard
In the pop-up, choose a name for the Dashboard (1). If you select "Private", the Dashboard will only be visible to you. If you select "Public", the Dashboard will be visible to all your team members that have access to the project (2)
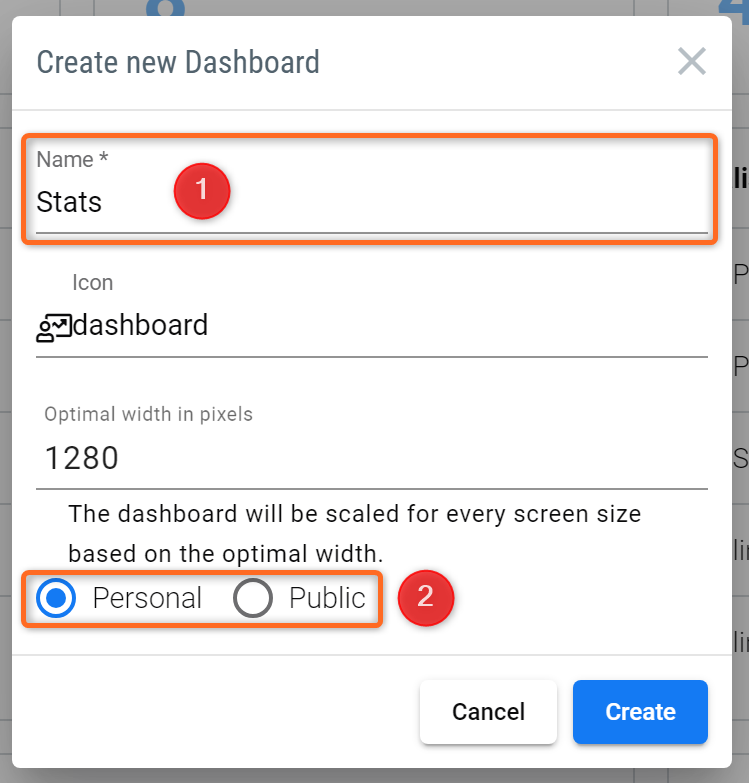
Properties of Custom Dashboard
Choose Initial and Visible Dashboards
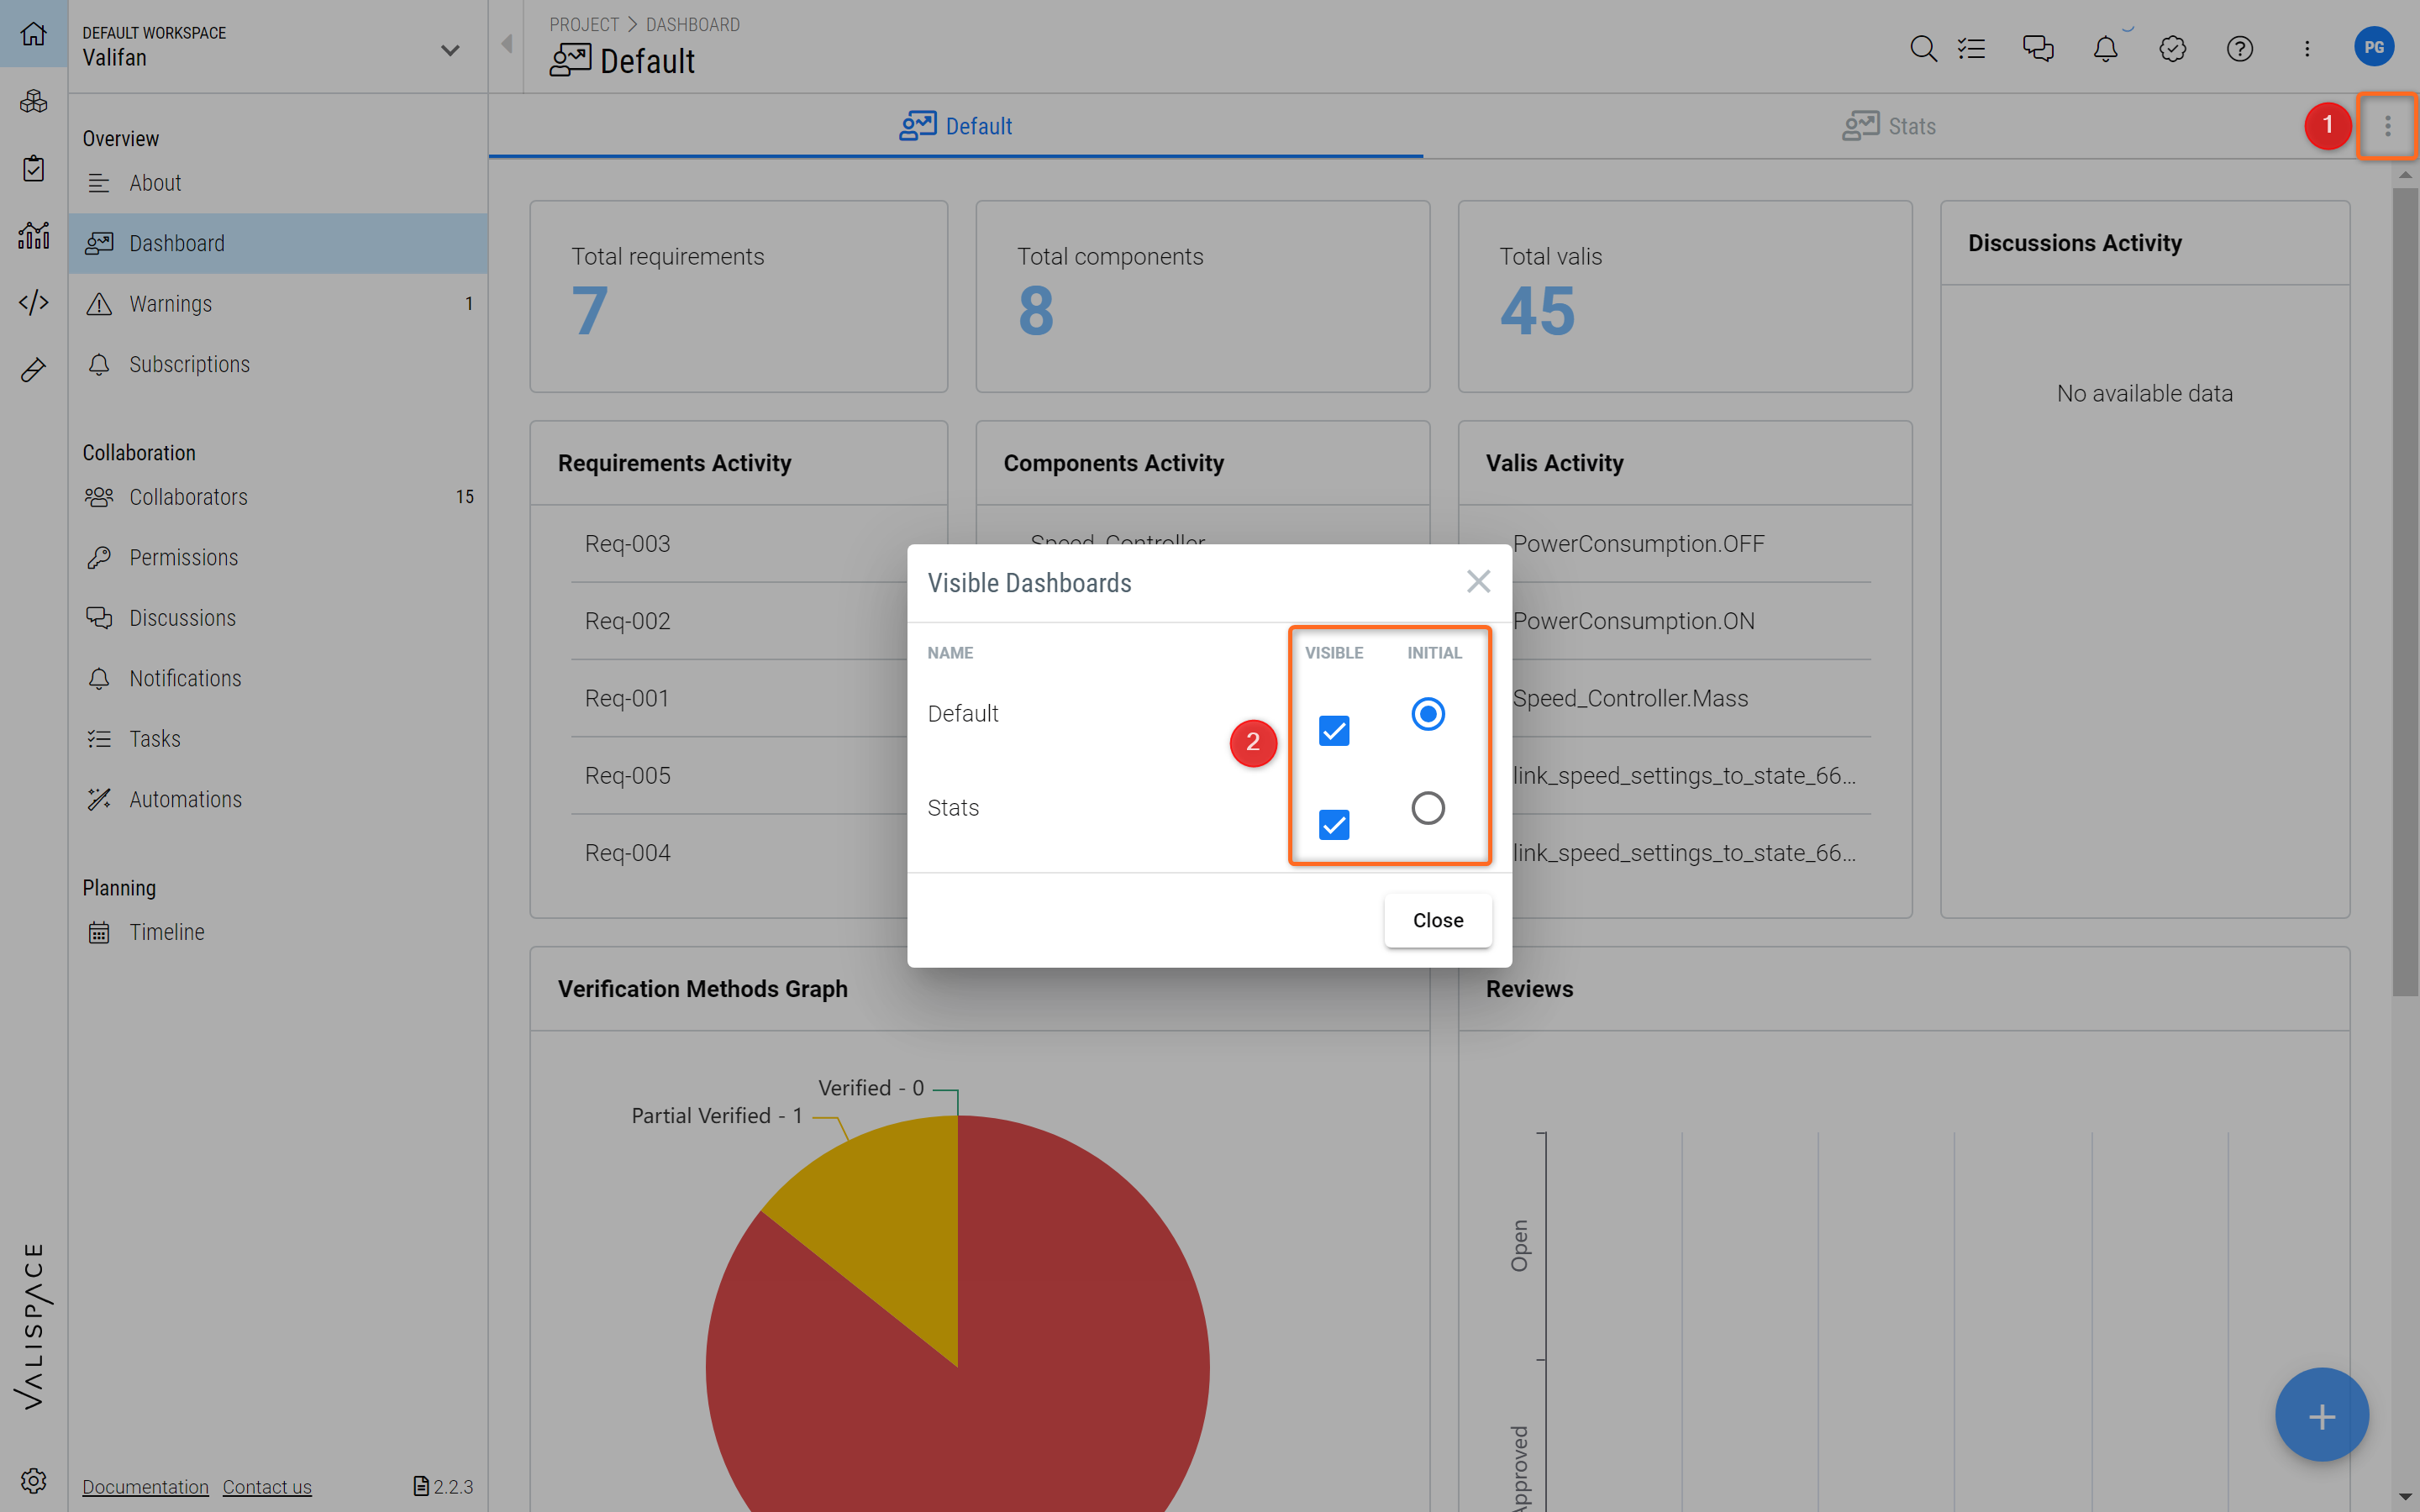
Click on the three dots button on the top right-hand side corner for "More options". Click on "Visible Dashboards" (1)
In the pop-up menu, you can now choose your "Initial Dashboard". This is the dashboard that will show up whenever you visit the Dashboard site. To remind you how to find the Dashboard site: from the Requirements and Systems Portal's main navigation pane, go to "Project" --> open "Dashboard"
Furthermore, you can hide Dashboards by removing the tick mark in the "visible" column (2)
Add Information to your Custom Dashboard
You can add information to your custom dashboard by adding blocks. There are different sets of blocks that allow users to customize their dashboards based on their needs. To add blocks, hover over the "+" bottom in the lower right-hand side corner and select "Add Block" to add information to your dashboard.
Adding Blocks
From the pop-up, choose the kind of information that you would like to display on your dashboard. The blocks will automatically update themselves and always show the current status of your project.
Here is an overview of the different types of information you can add to your Dashboard.
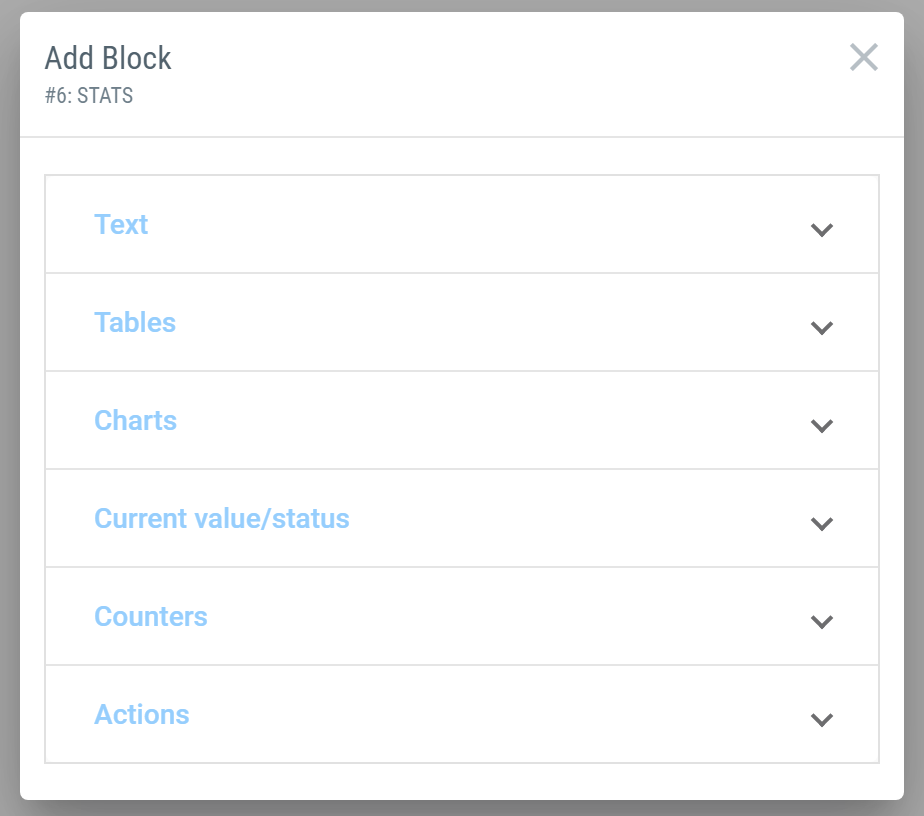
Block Options - These are the different types of information a user can add to their custom dashboards.
Text
With the help of Text Blocks, you can add headlines, normal text, quotes, and formulas to your Dashboard.
Tables
The tables give you an overview of your project in the form of a table and it can contain the following information:
Budget Table: displays the budget of your Valis (with sum of children functions), e.g. the mass, and power (in form of a table)
Blocks Table: displays a list of all of your Blocks in your project
Properties Table: displays a list of all of your Valis in your project
Modelists Table: displays a list of all of your Modes in your project
Requirements Table: displays a list of all of your Requirements of your project
Verifications Table: displays a list of all of your Verifications in your project
Analyses Table: displays a list of all of your Analyses in your project
Simulations Table: displays a list of all of your Simulations in your project
The tables are similar to the blocks created in the Analyses Module. However, the dashboard tables have more possibility to access the global overview information from other modules (simulation, analyses) as well.
Charts
The chart blocks are similar to the ones used in the Analyses Module. This function gives the user an overview of your project in the form of a chart.
Budget Chart: displays the budget of one of your Valis, e.g. the mass, in form of a pie chart
History Chart: displays the changes over time of one of your Valis, e.g. the mass, in the form of a line chart
Dataset Chart: display the datasets
Count Graph: this shows the total number of requirements along with the numbers of verified and not verified requirements. An example is shown in the below image:
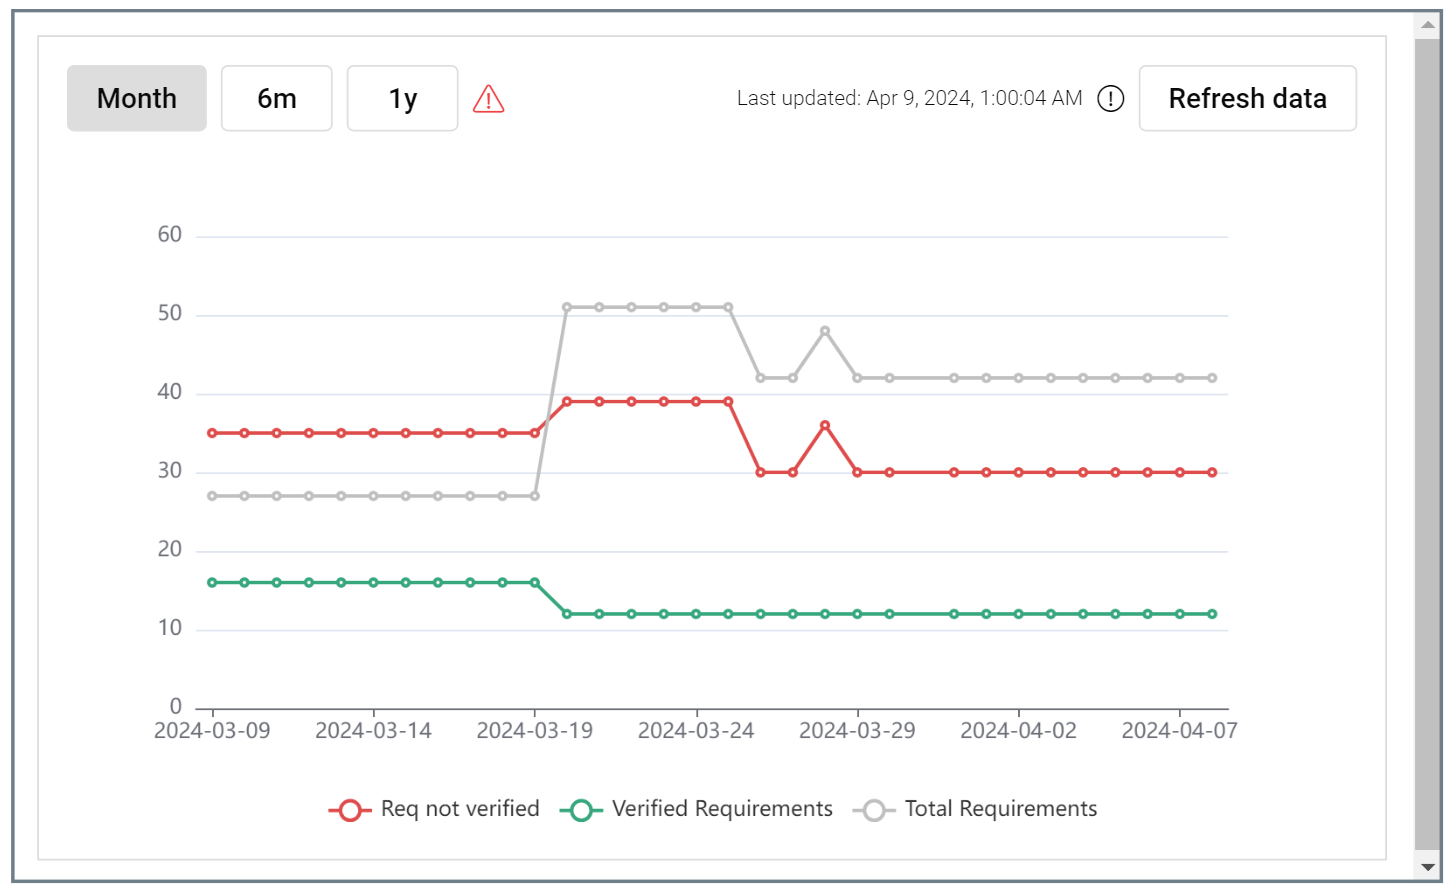
Count Graph - Shows you the overall Verification activity of your Requirements over time for the whole project.
Current Value/Status
These blocks always display the current value of one of your Valis.
Counters
With the help of counters, you can keep track of the number of Blocks, Valis, Modes, Requirements, Verifications, Analyses, and Simulations that you have in your project.
Dashboard Buttons
The dashboard also enables you to insert buttons to either access an URL/link or trigger external scripts or add files.
To insert buttons:
Navigate to the dashboard you would like to add the button into
Click on the “+” add button in the bottom left-hand corner of the screen
Click on “Add Block”
Navigate to the “Actions” section
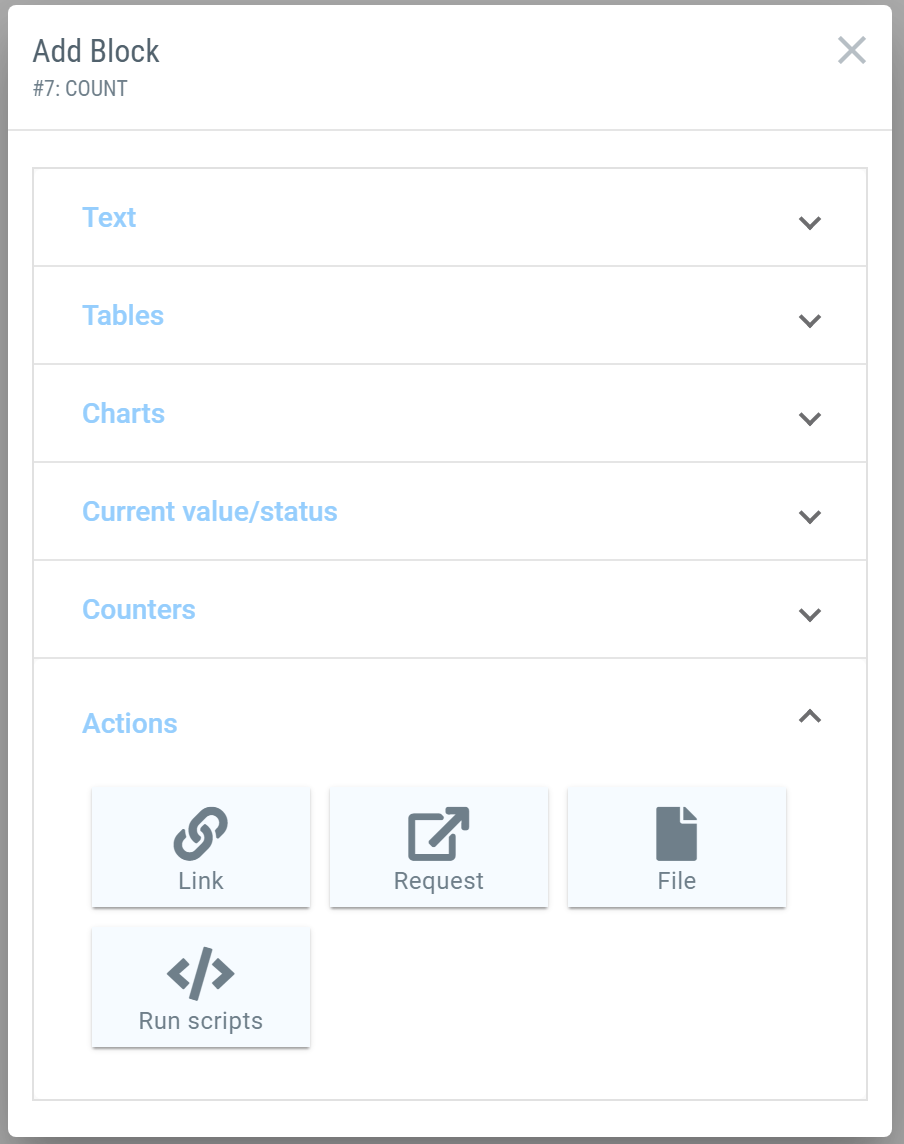
To insert a button that leads to a specific link click on the “Link” icon and then access the settings of that button.
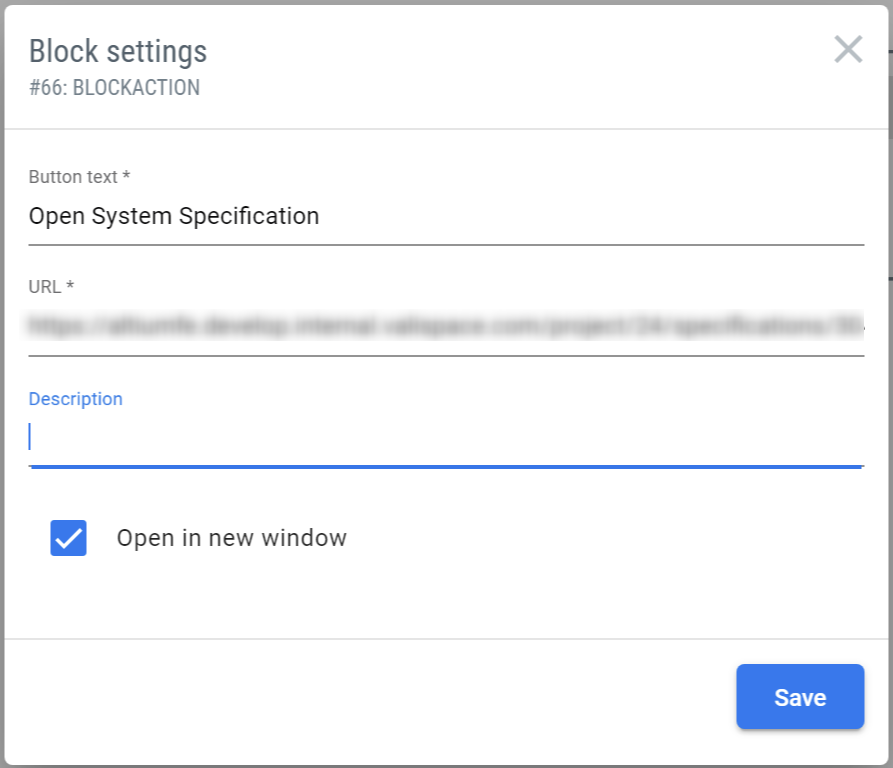
Insert the text you would like to appear on the button in the “button text” field.
To create a button for a “Request” click on the request button
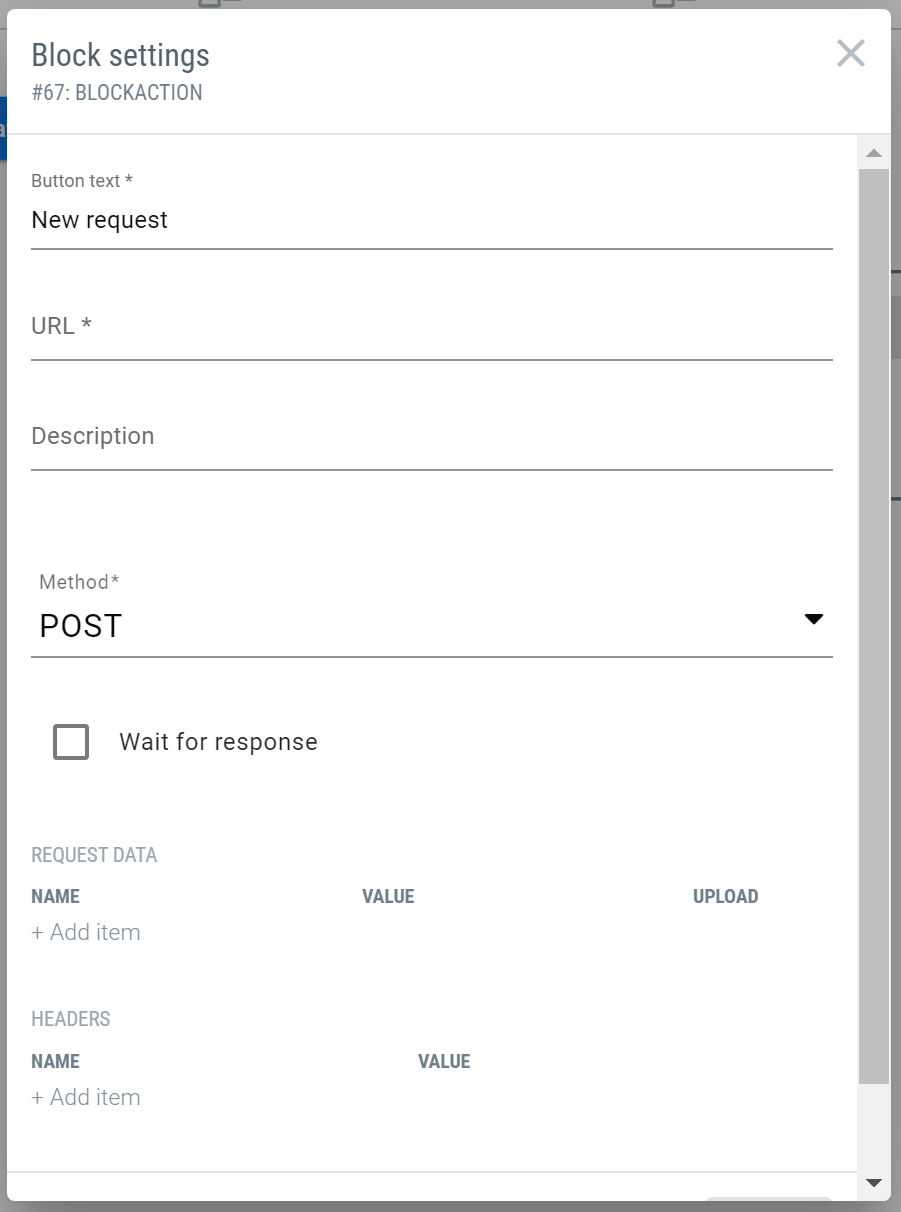
You have the option to choose the method of a request under “Request”.
By ticking the “Wait for response” box, the request button will remain greyed out until the request has been processed.
Insert the request data in the field and click save to insert the request button into the dashboard.
Personalize Blocks in your Dashboard
Within the dashboard, the blocks can be organized by either resizing or moving and the information can be managed by adding the Valis to the tables.
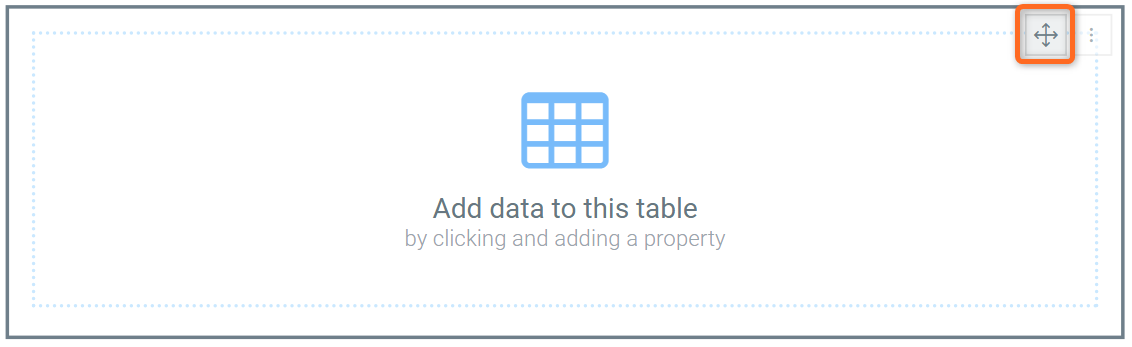
Click on "Add Blocks" and choose to add a "Budget Table" to your Dashboard. An empty field will show up.
With the help of the button in the top right-hand side corner, you can move it around in your dashboard.
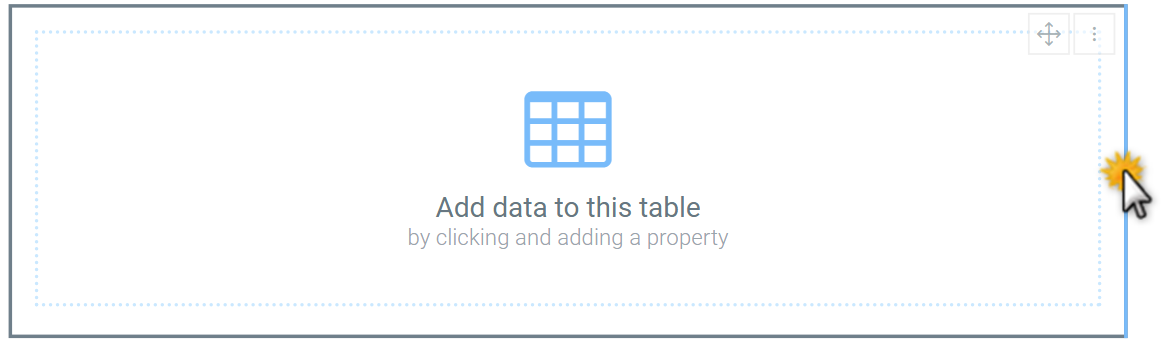
To resize the block, simply click on the borders of the block to get the readjustment cursor and move it accordingly to your needs.
Now click on "Add data to this table". In the pop-up, click on the "edit" button and start typing the name of the Vali you would like to add. In our example, we choose "Spacecraft mass" from the Satellite_valisat project. The table now displays the mass of the fan including margins.
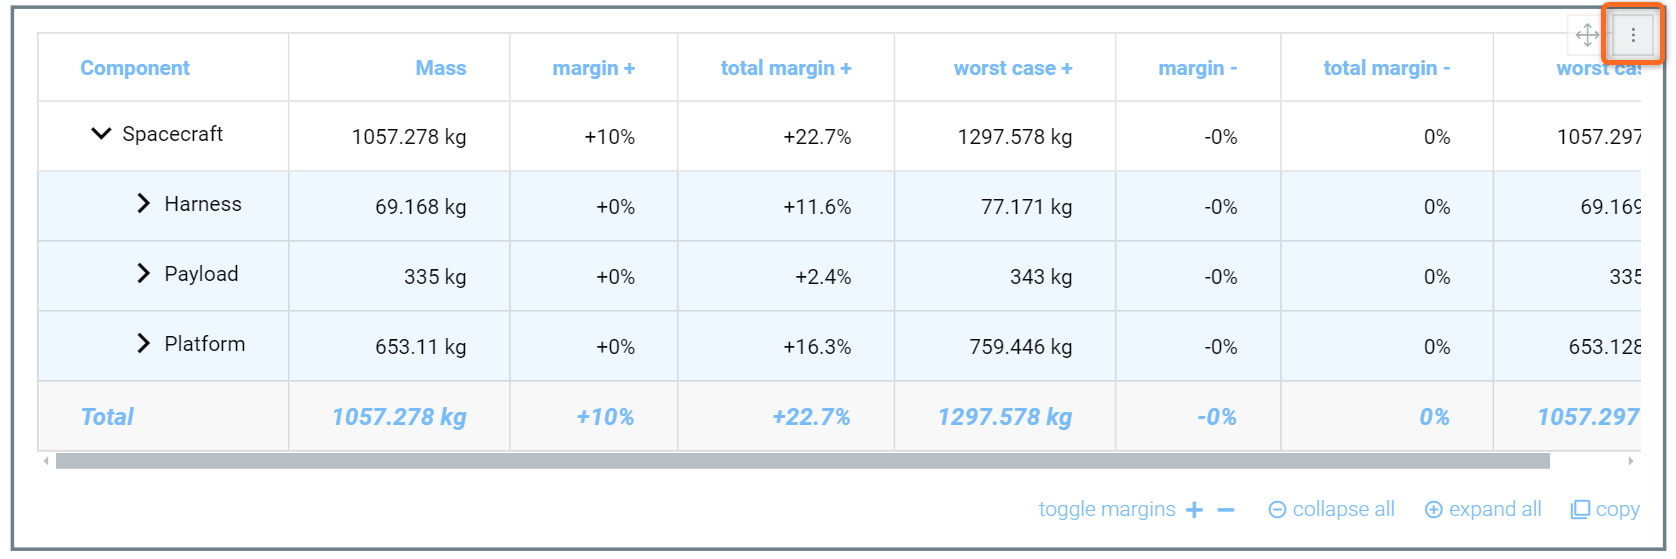
Budget Table - By selecting the right Vali from the System Design Module the Mass breakdown of a System can be displayed.
If you like to change the Vali that is being displayed in the tables or delete the block, click on the button in the top right-hand side corner of the table.
If you add a Table of Requirements or Verifications to your Dashboard, you can even filter with advanced settings (contains, AND, OR, not equal to) and sort the items in the table, e.g. by date of creation or by the status of verification/name.
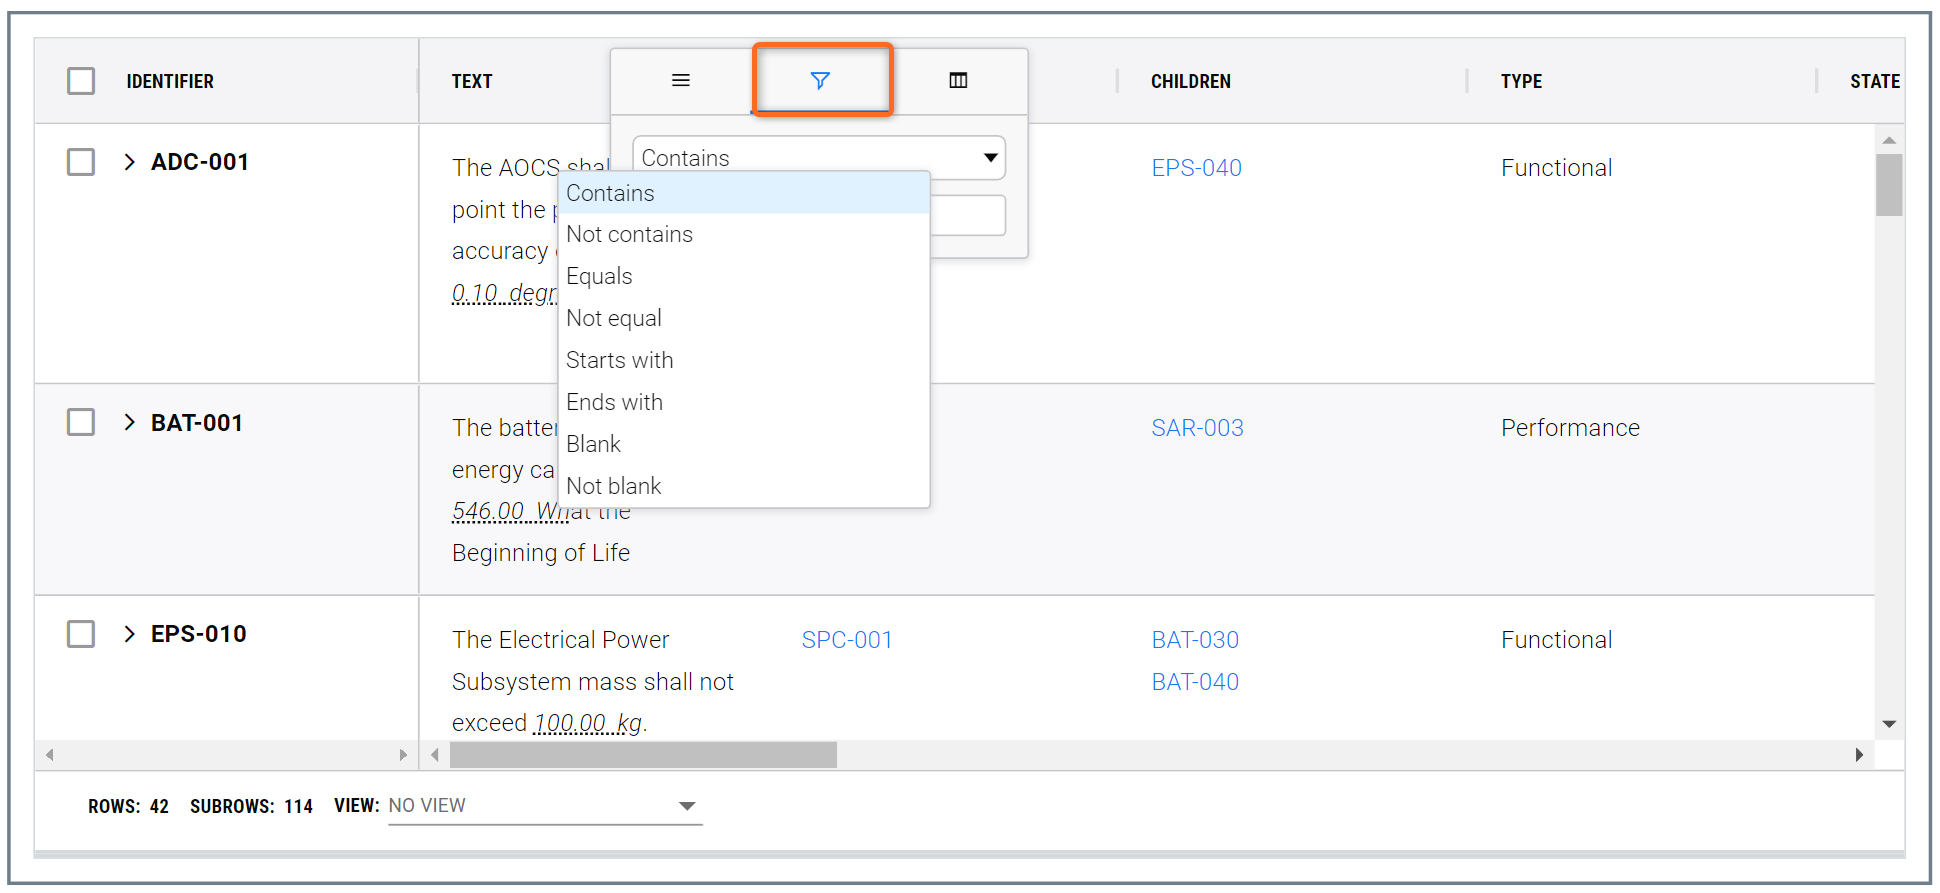
This way you can display exactly the Requirements you would like to show in that specific custom dashboard.