Release 1.93.34 (03 April 2024)
Verification Burndown count graph in “Insights”
In this version, we introduced a count graph feature that enables users to track the verification progress of requirements over time effectively. Offering customizable timeline views—monthly, semi-annually, or annually—it provides a clear visual representation of the number of requirements verified versus those pending verification.
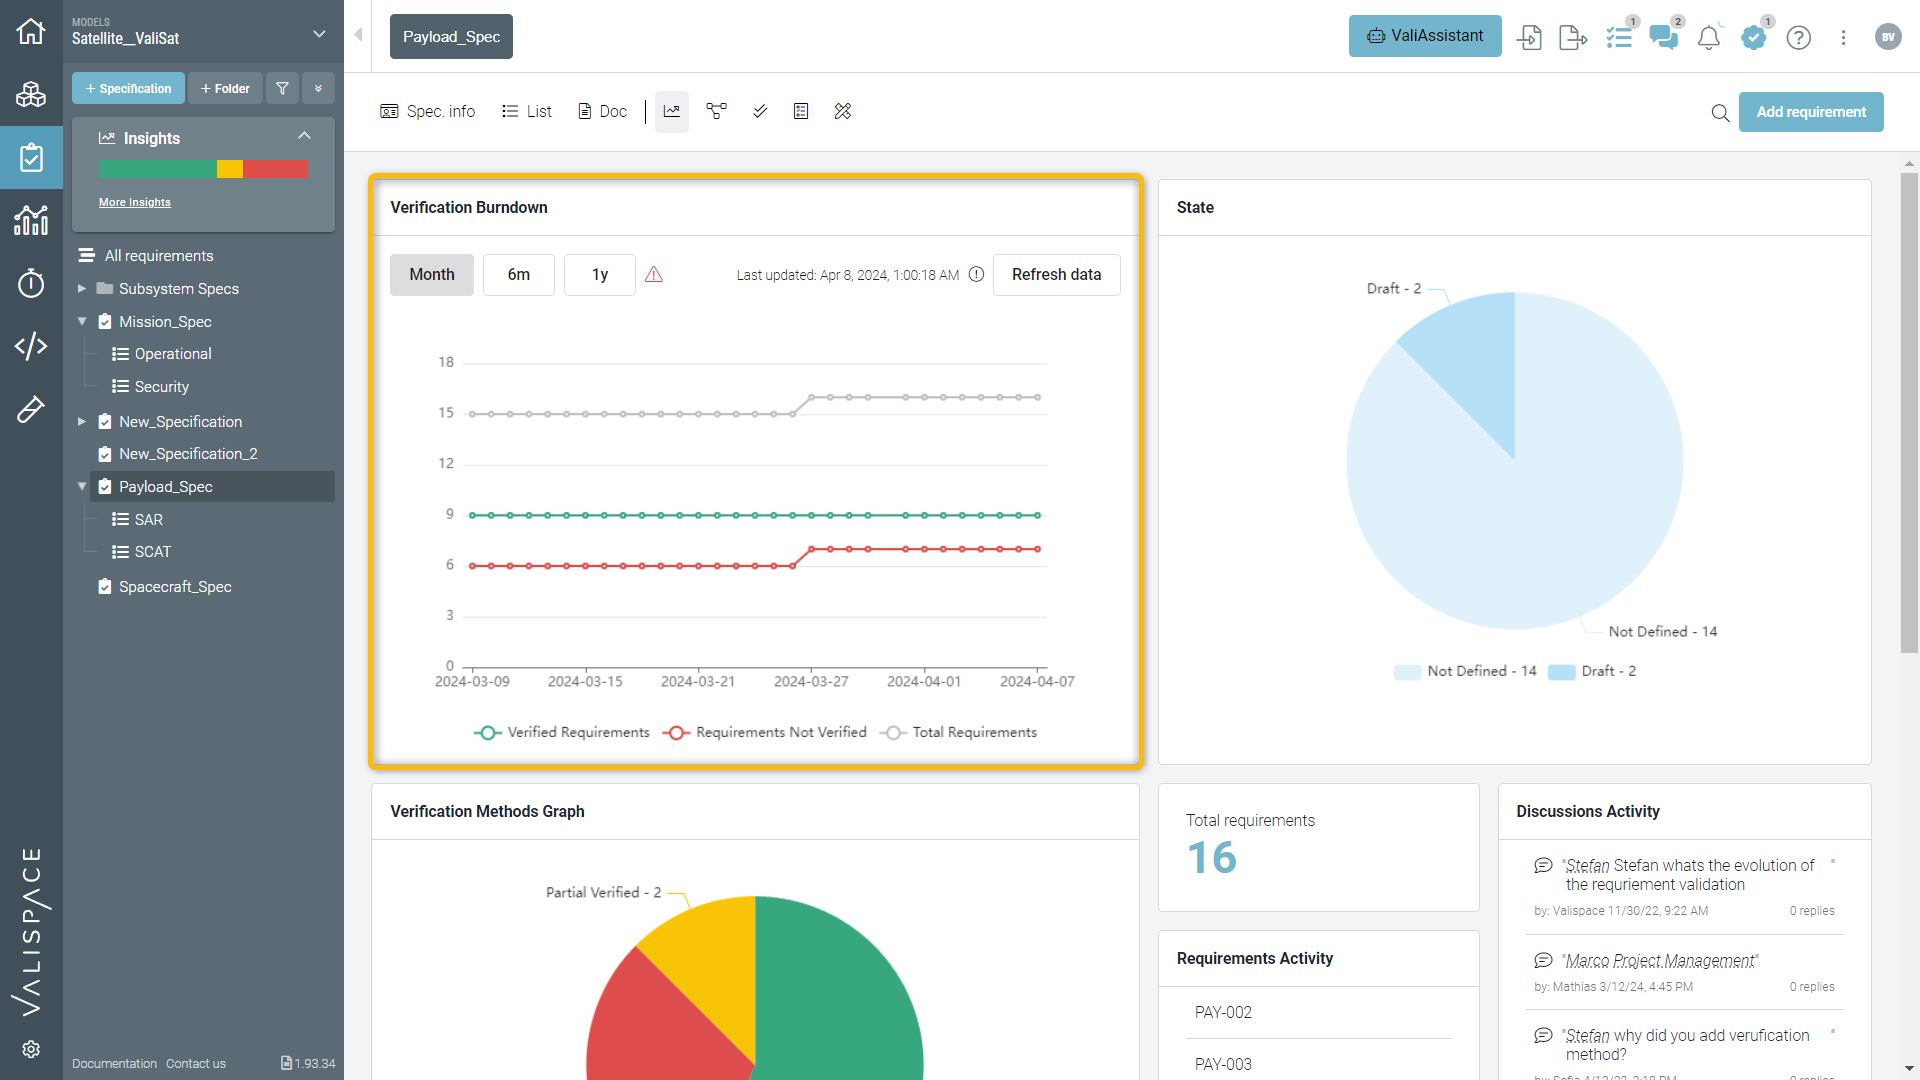
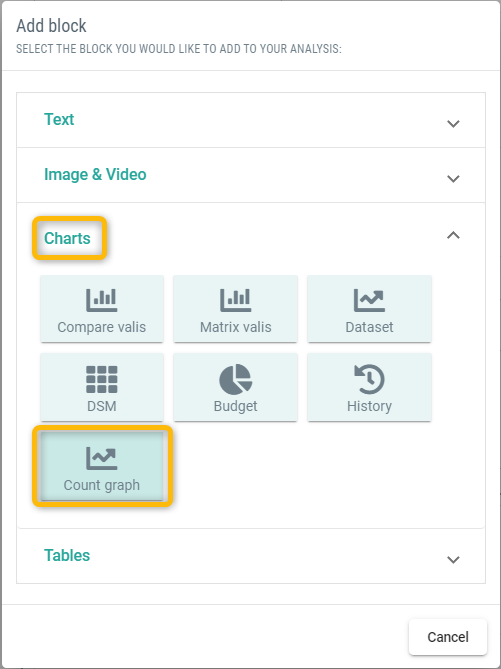
The users can create this count graph in “Analyses” module or in dashboard by adding a new block and then selecting the charts and then the Count graph. Please refer to the image below.
UX-UI Changes
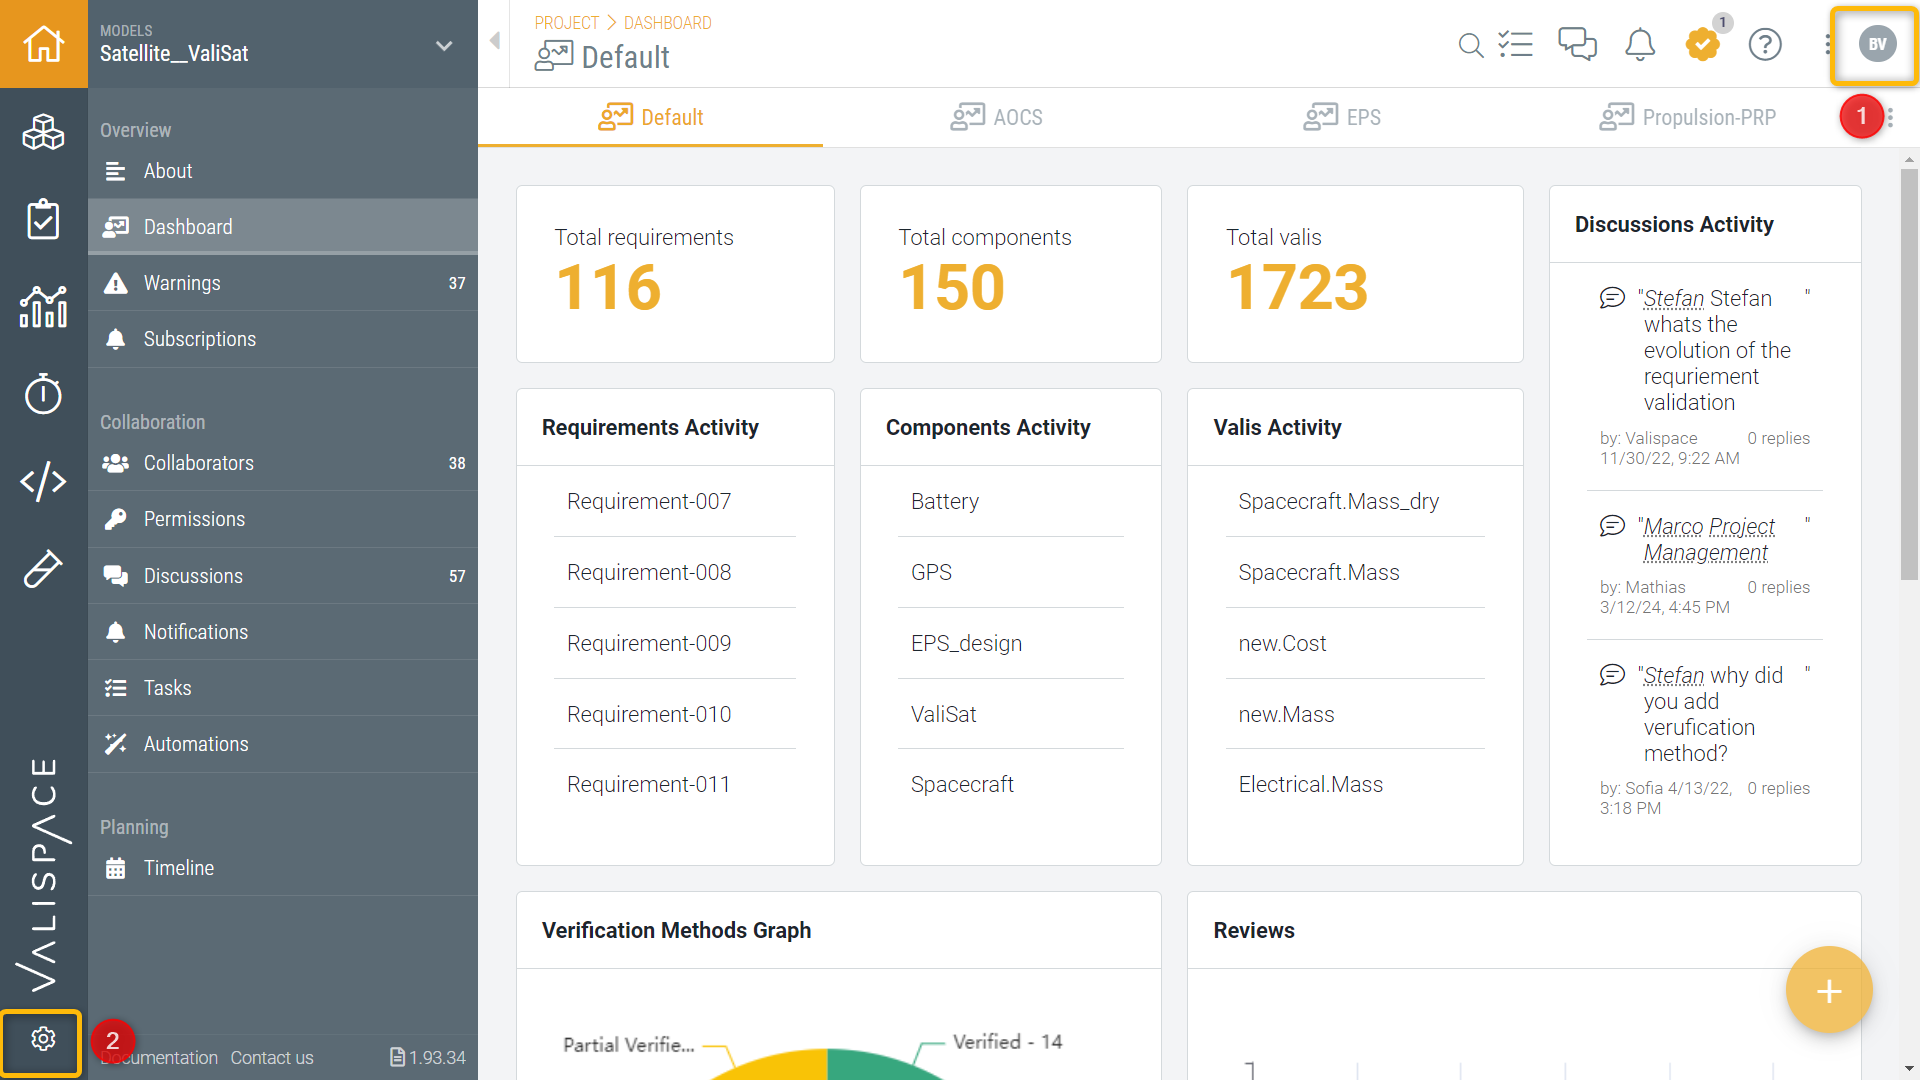
Minor UX/UI improvements have been performed, such as the User profile (1) being moved to the top right corner and the settings and other actions (2) being moved to the left-bottom corner of the valispace. Please refer to the image below.
Reuse Feature - Bug fix for the Bulk reuse requirements creating nested sections
The latest update addresses a previously identified issue: utilizing the "Bulk selection" function for requirements, coupled with the reuse feature, inadvertently created nested sections. This behaviour has been corrected, ensuring a more seamless user experience.